
Macro and Global Liquidity Analysis: Gold, Silver, and Bitcoin – September 2025
Disclosure
This article is intended solely as general commentary on global markets and does not constitute personal financial advice. The content presented is based on current information and opinions, and may change without notice. Readers should not rely on any information in this publication when making investment decisions but instead should seek professional advice tailored to their own circumstances. In addition, any recommendations or views expressed herein may conflict with the allocation strategy or holdings of the Ainslie Bitcoin & Bullion Fund.
Today the Ainslie Research team brings you the latest monthly update on where we are in the Global Macro Cycle, driven by the Global Liquidity Cycle, and the implications for Gold, Silver, and Bitcoin. This summary highlights the key charts discussed with our expert panel on Tuesday. We encourage you to watch the recorded video of the presentation in full for the detailed explanations.
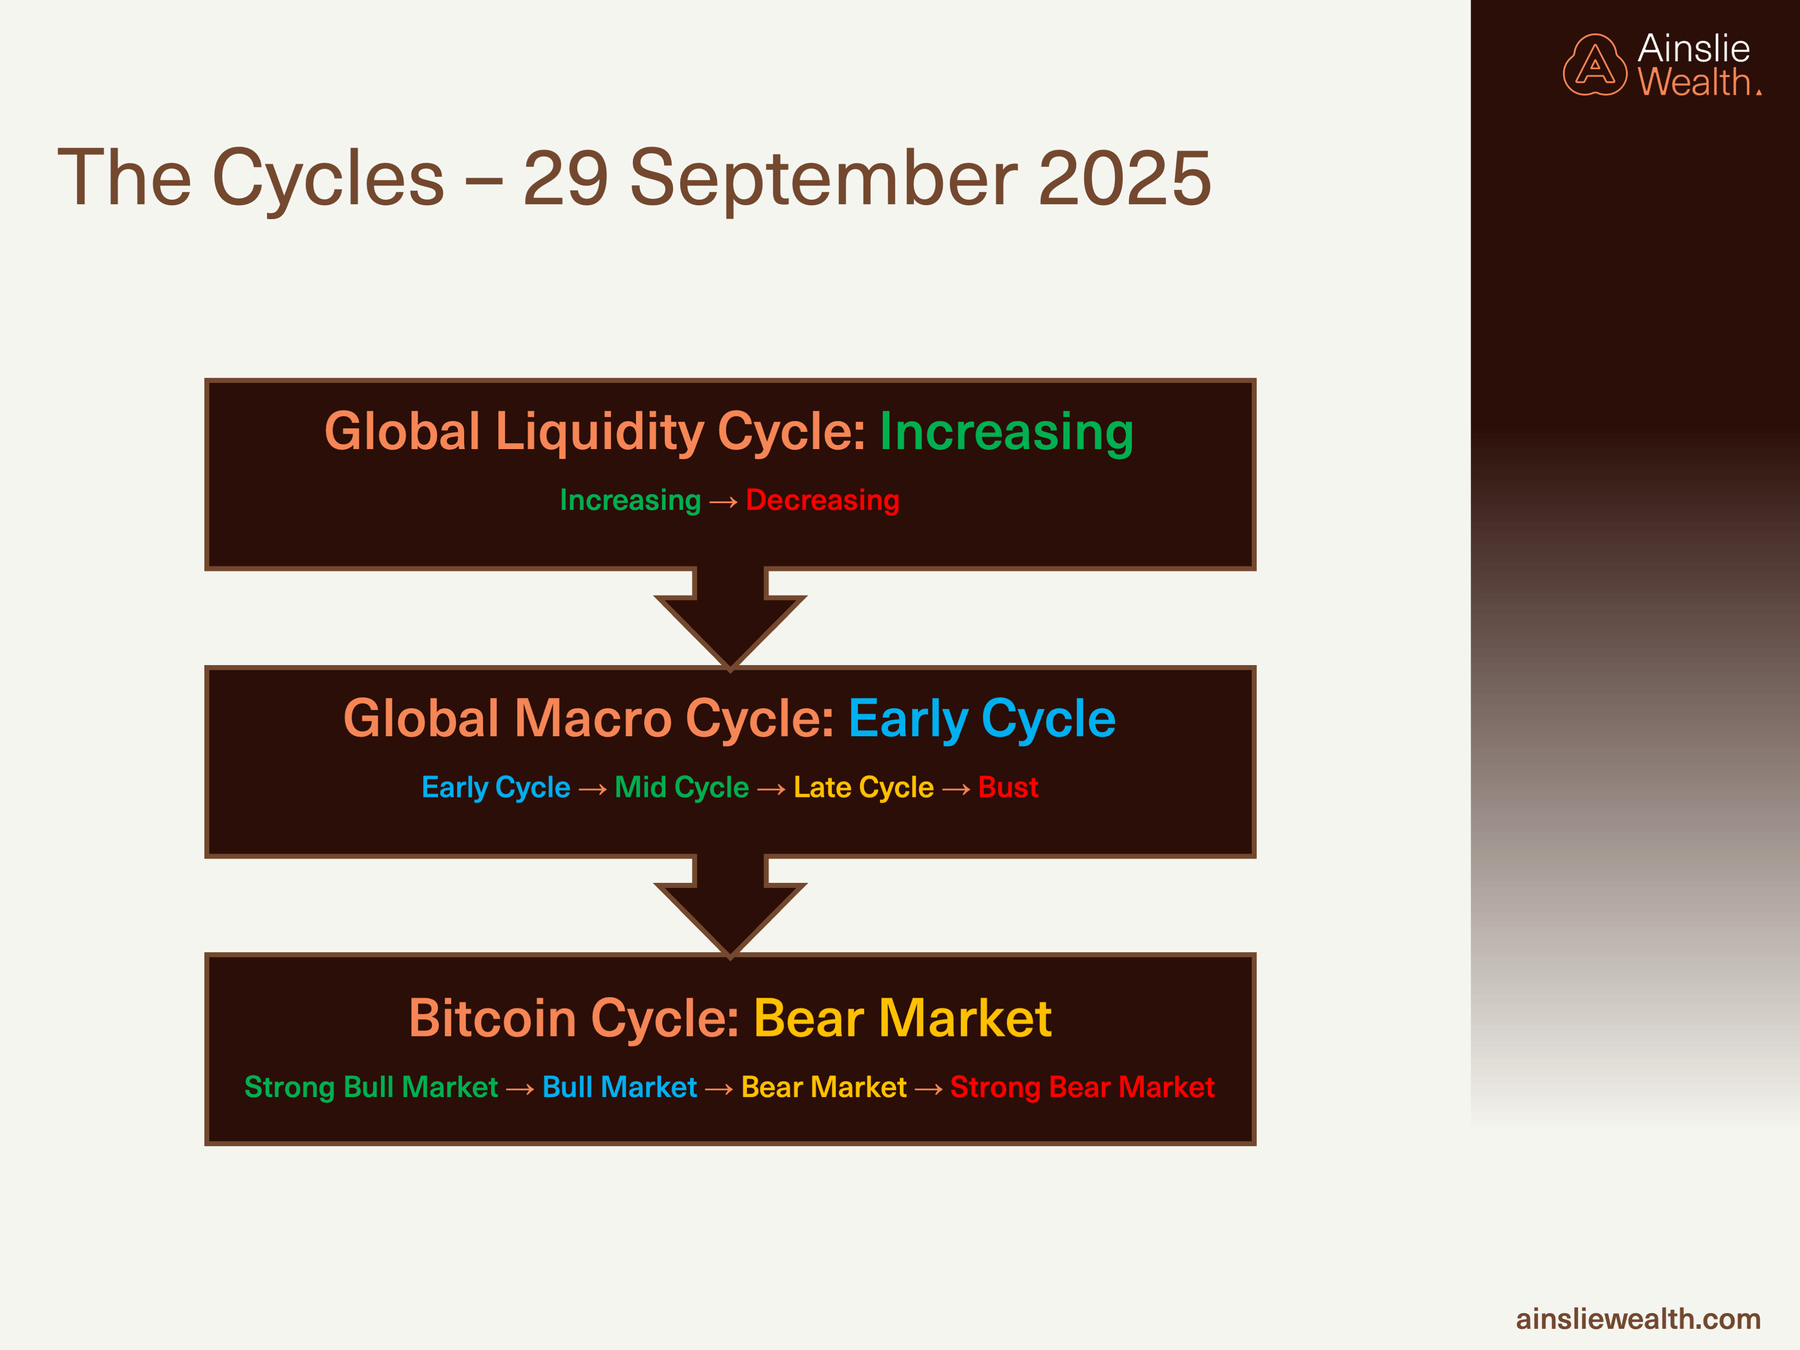
Where are we currently in the cycles?
The latest assessment positions the market in an early cycle phase, marked by persistent liquidity fluctuations that have prolonged the transition toward mid-cycle expansion. Global equity trends display positive momentum, but the broader macro landscape remains characterised by moderate growth and subdued inflation, tempered by recency bias from previous high-velocity cycles. Bitcoin's indicators have shown temporary bearish momentum, introducing nuance, while precious metals exhibit ongoing strength. This configuration implies a potential extension of sideways movement, avoiding the sharp peaks of past cycles, and underscores the importance of comprehensive metric analysis to manage interim volatility and capitalise on liquidity-driven prospects.
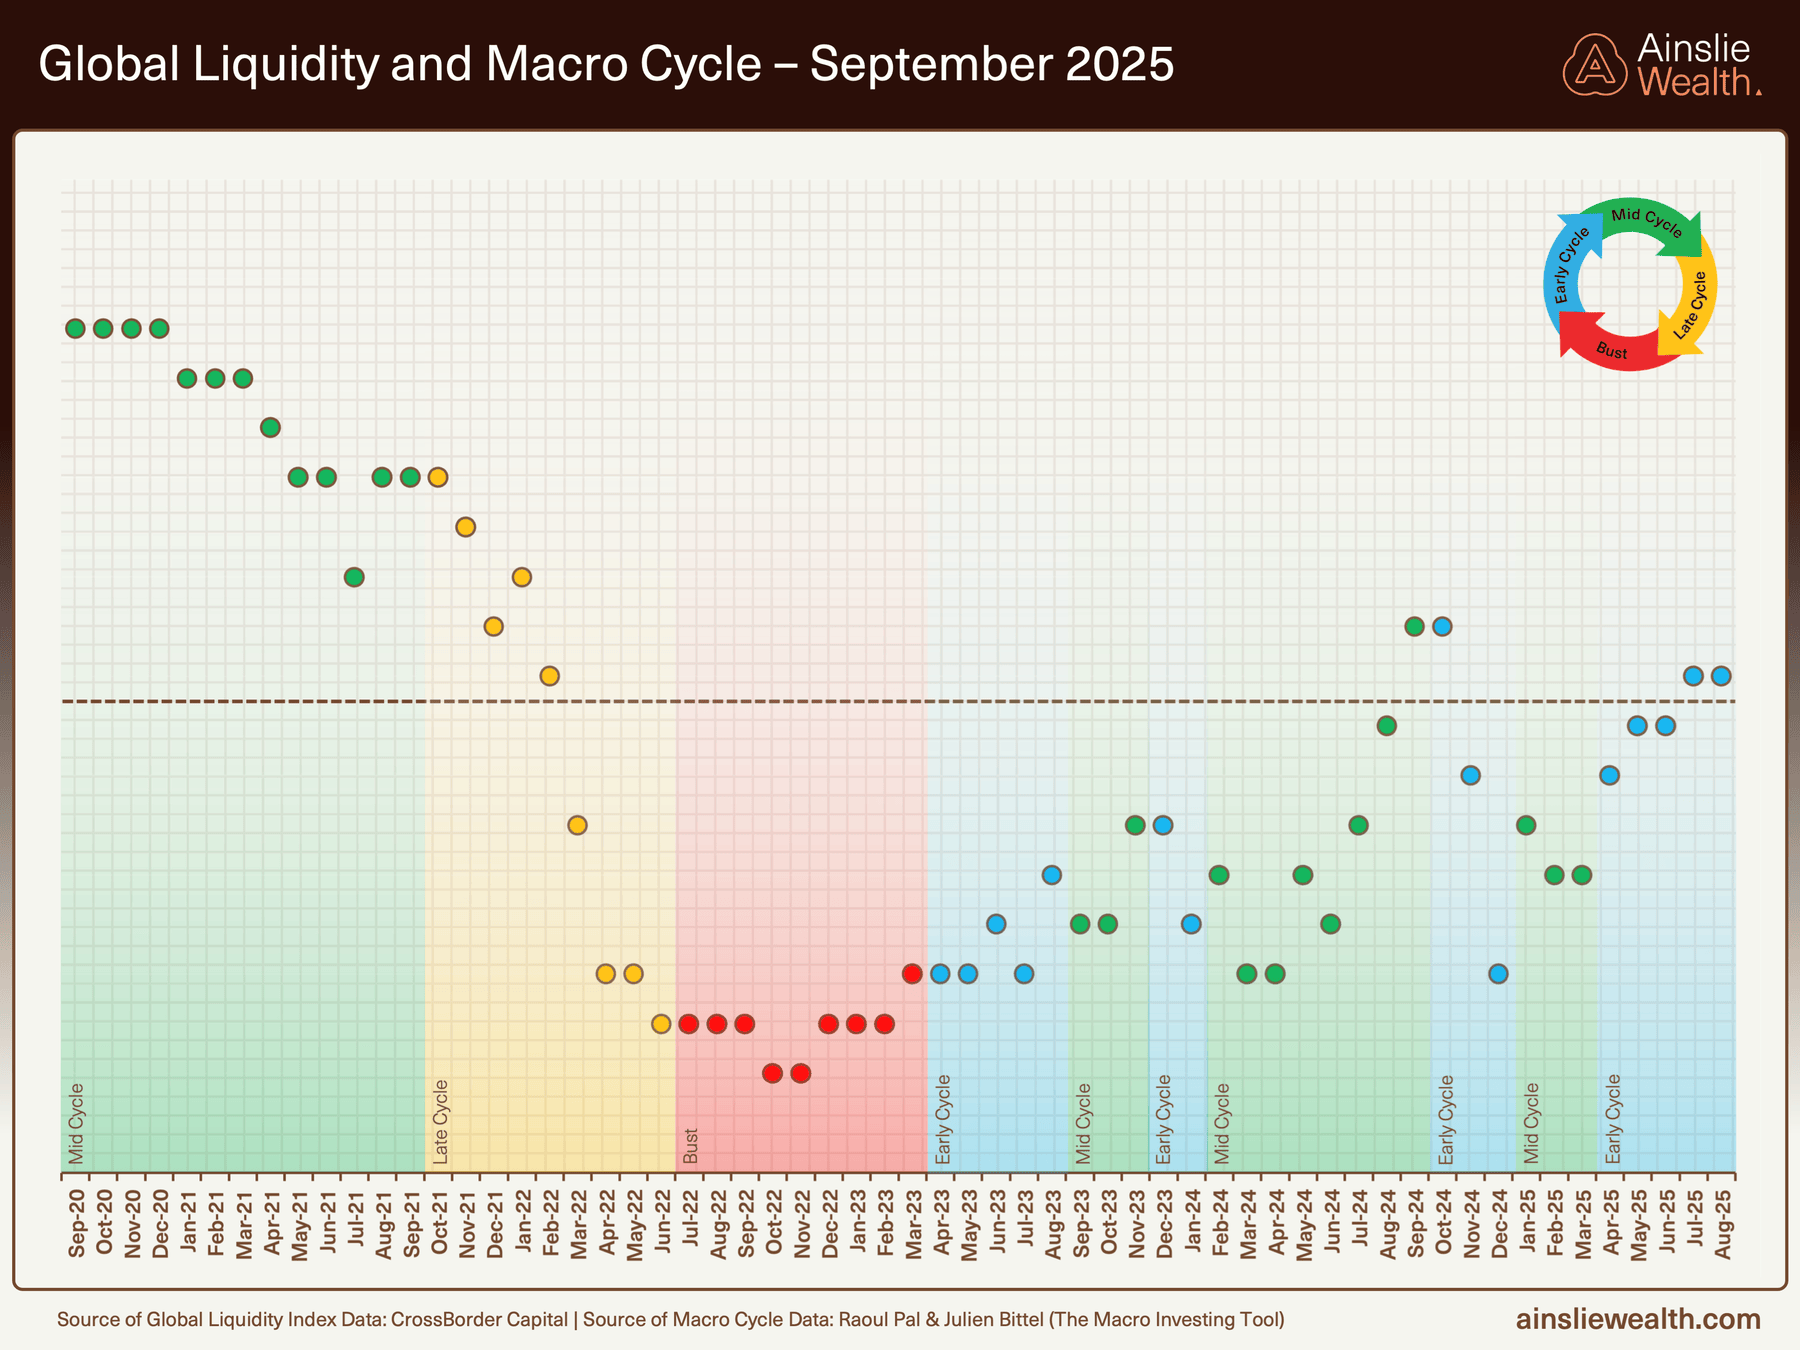
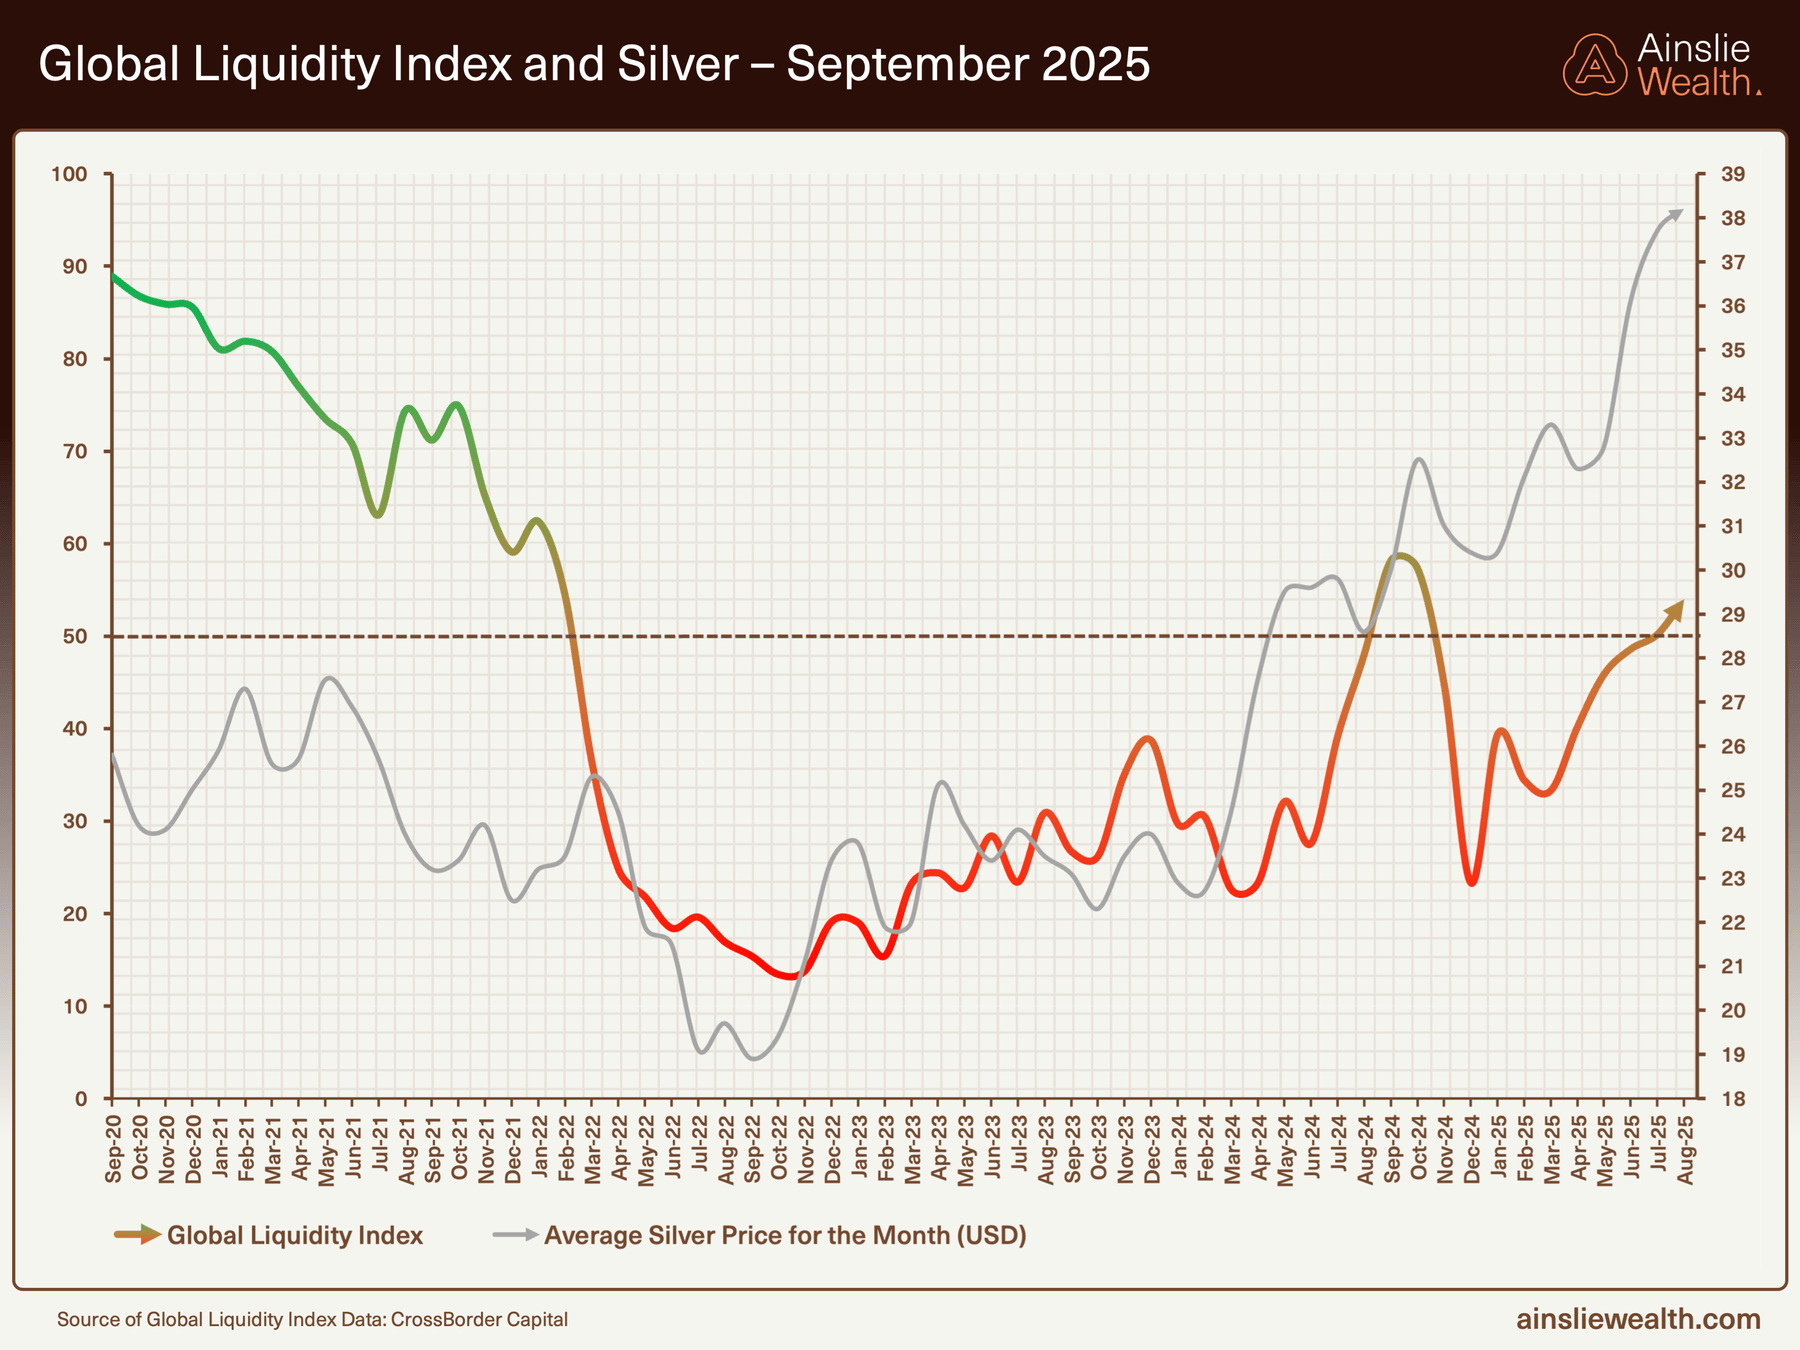
Deep dive on the Global Liquidity Cycle
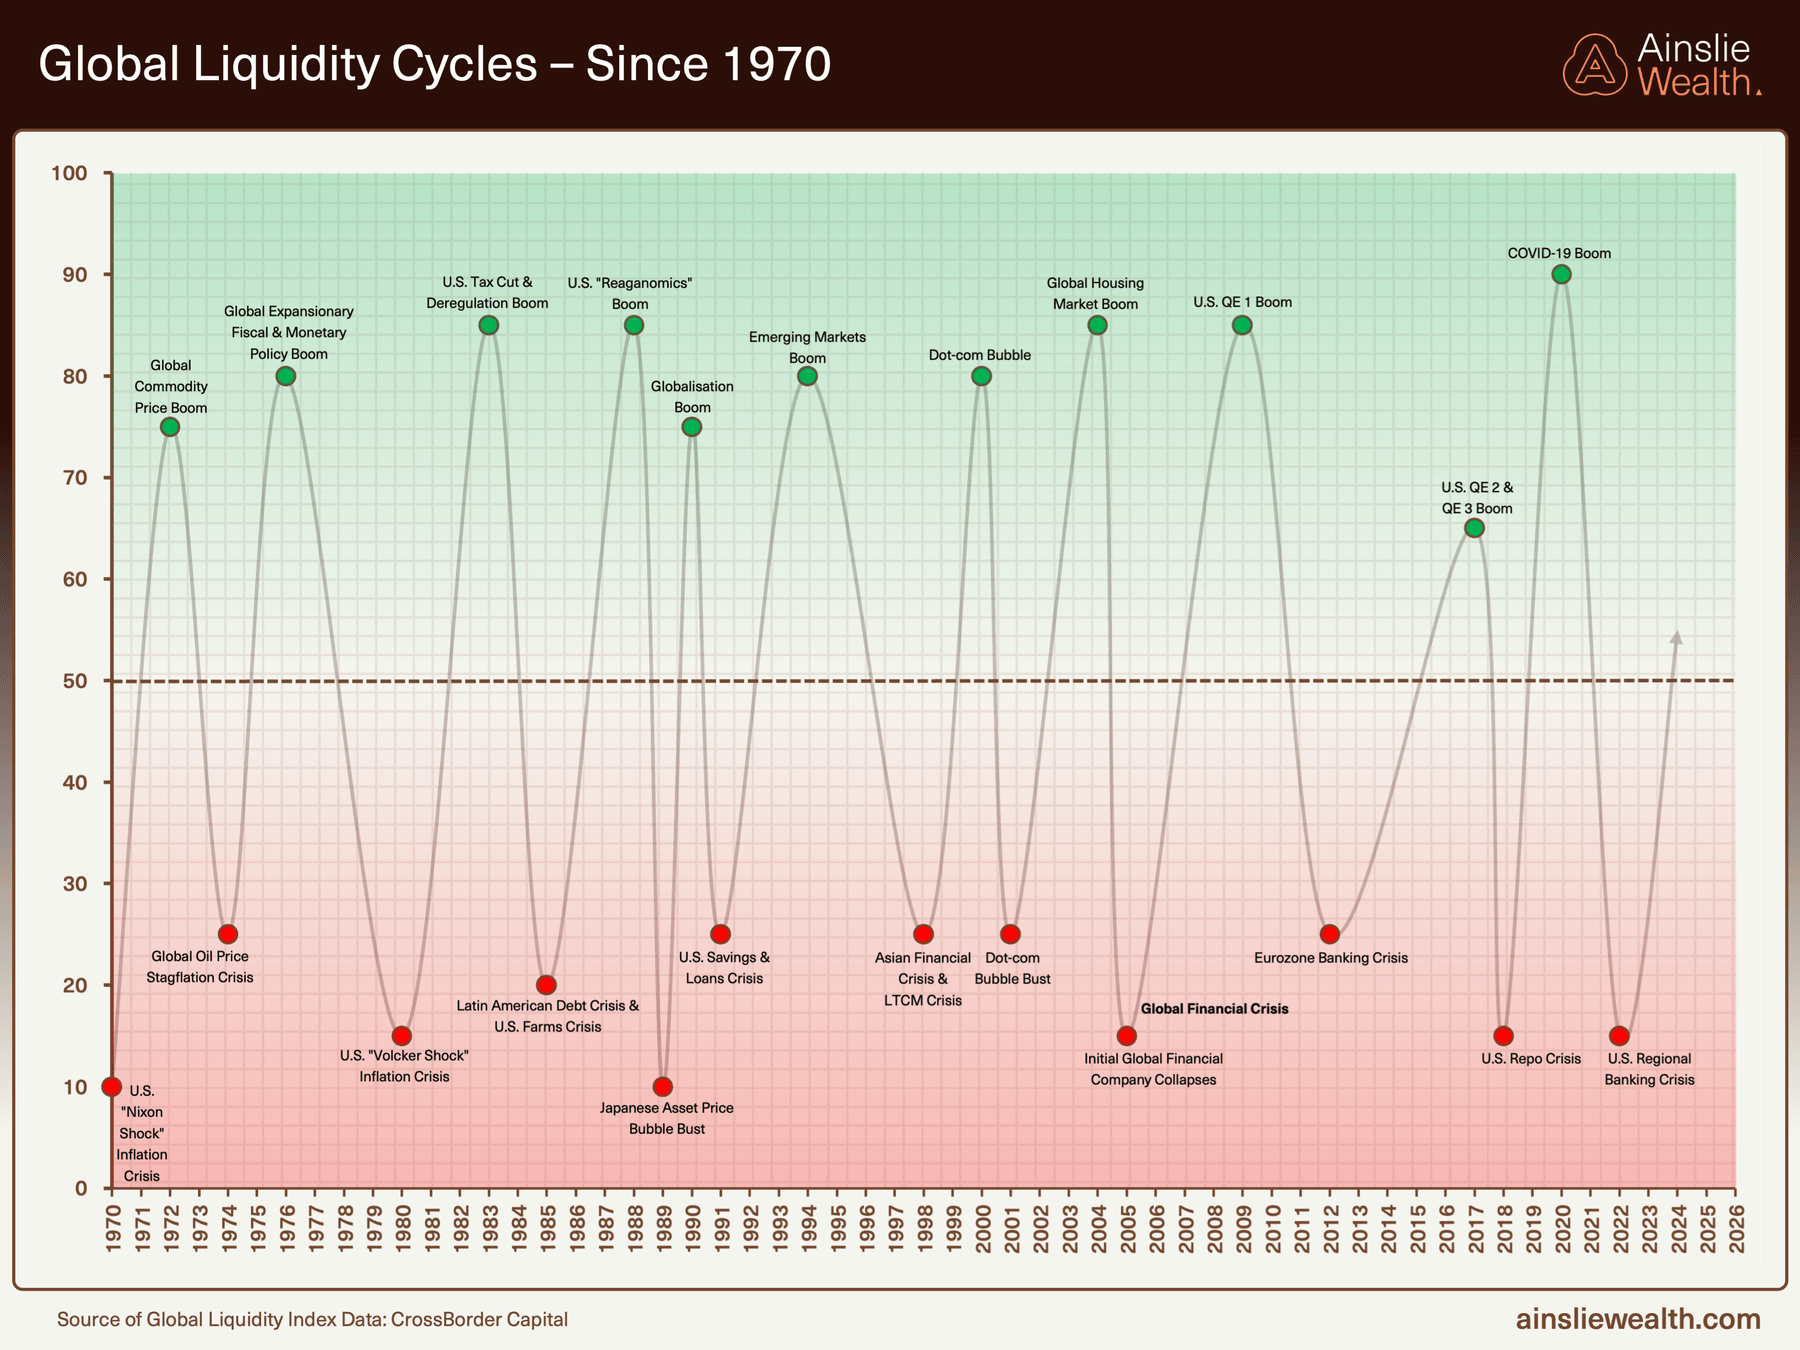
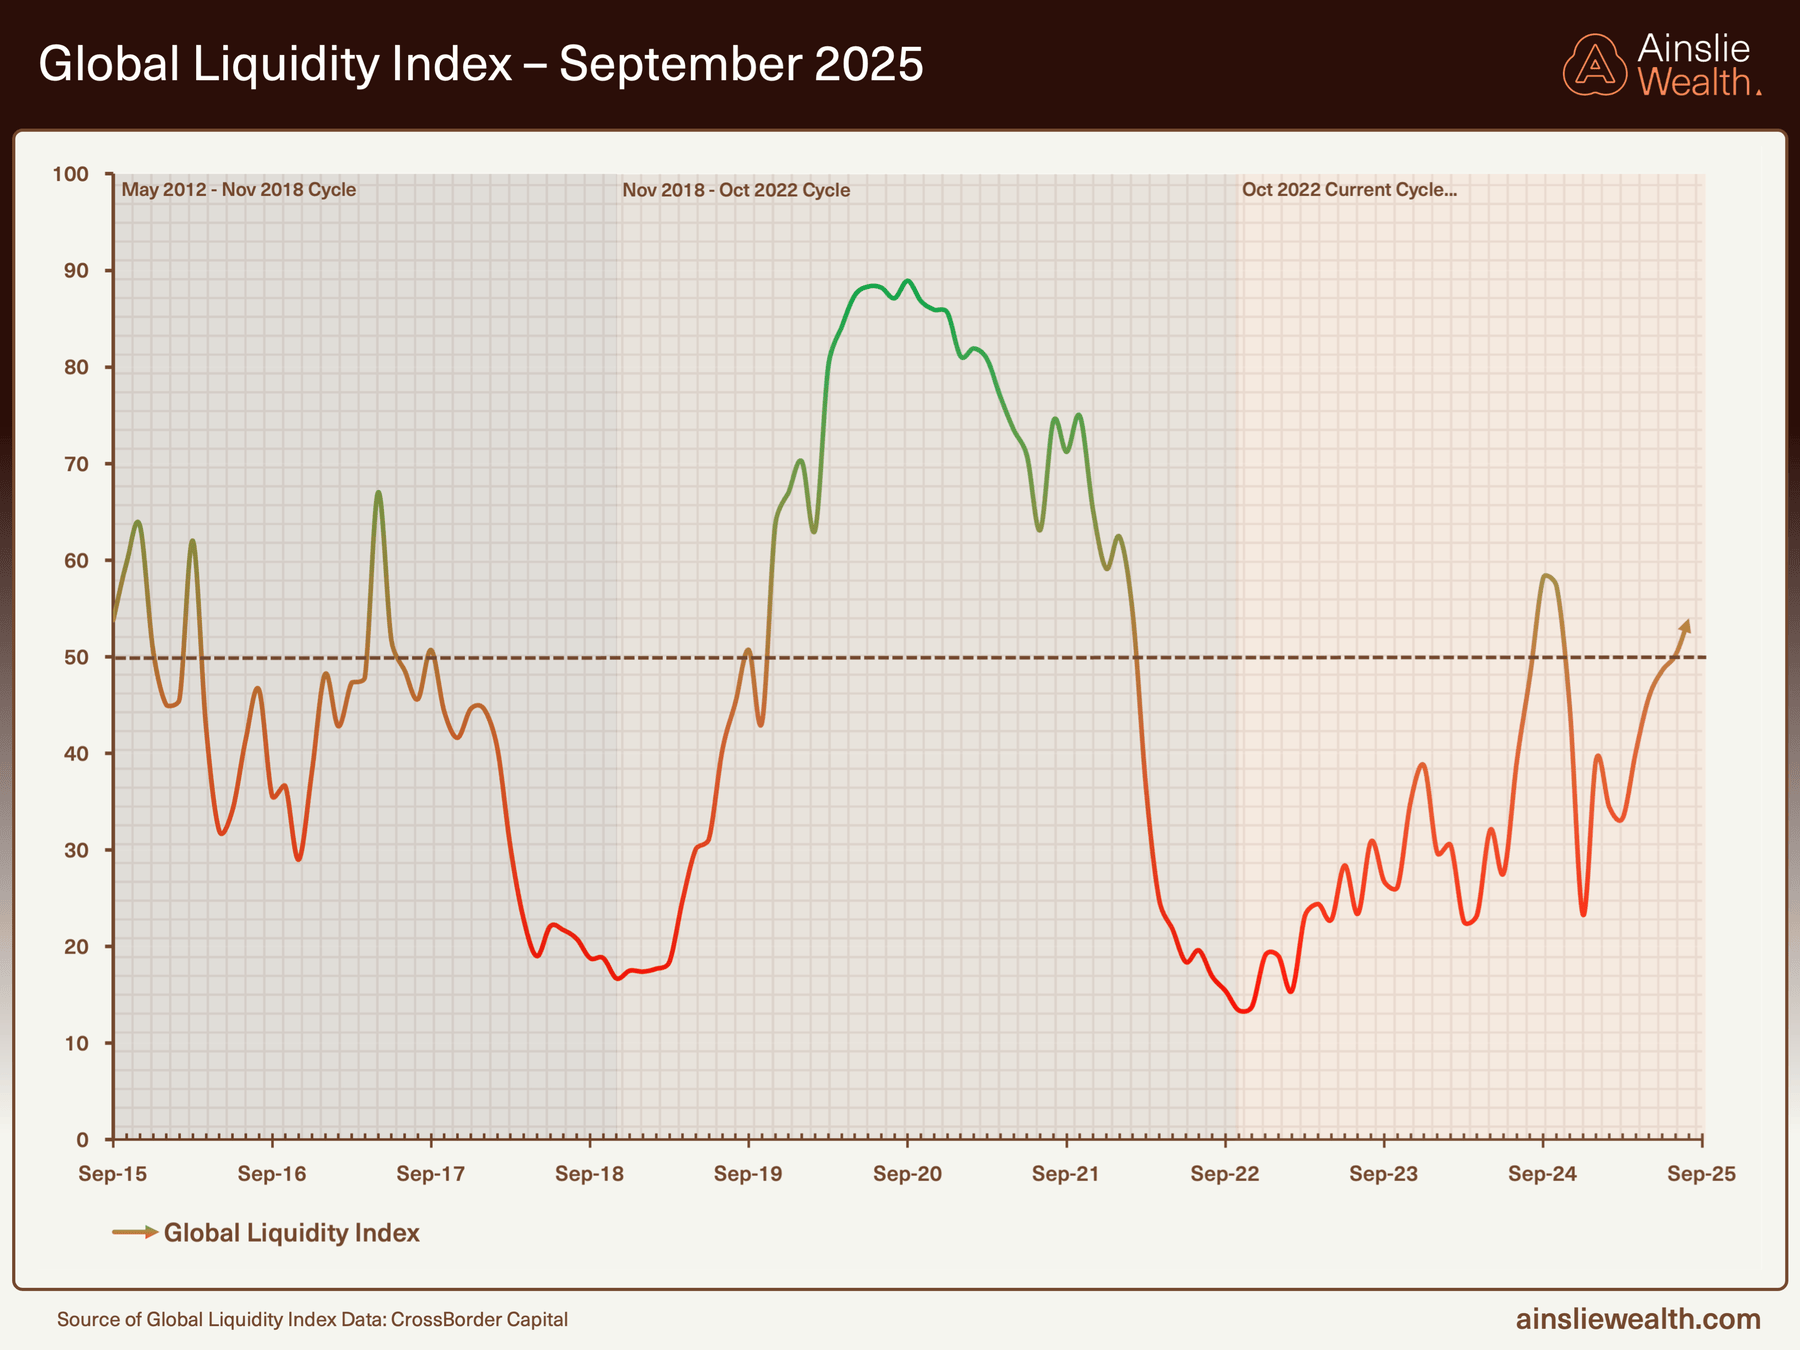
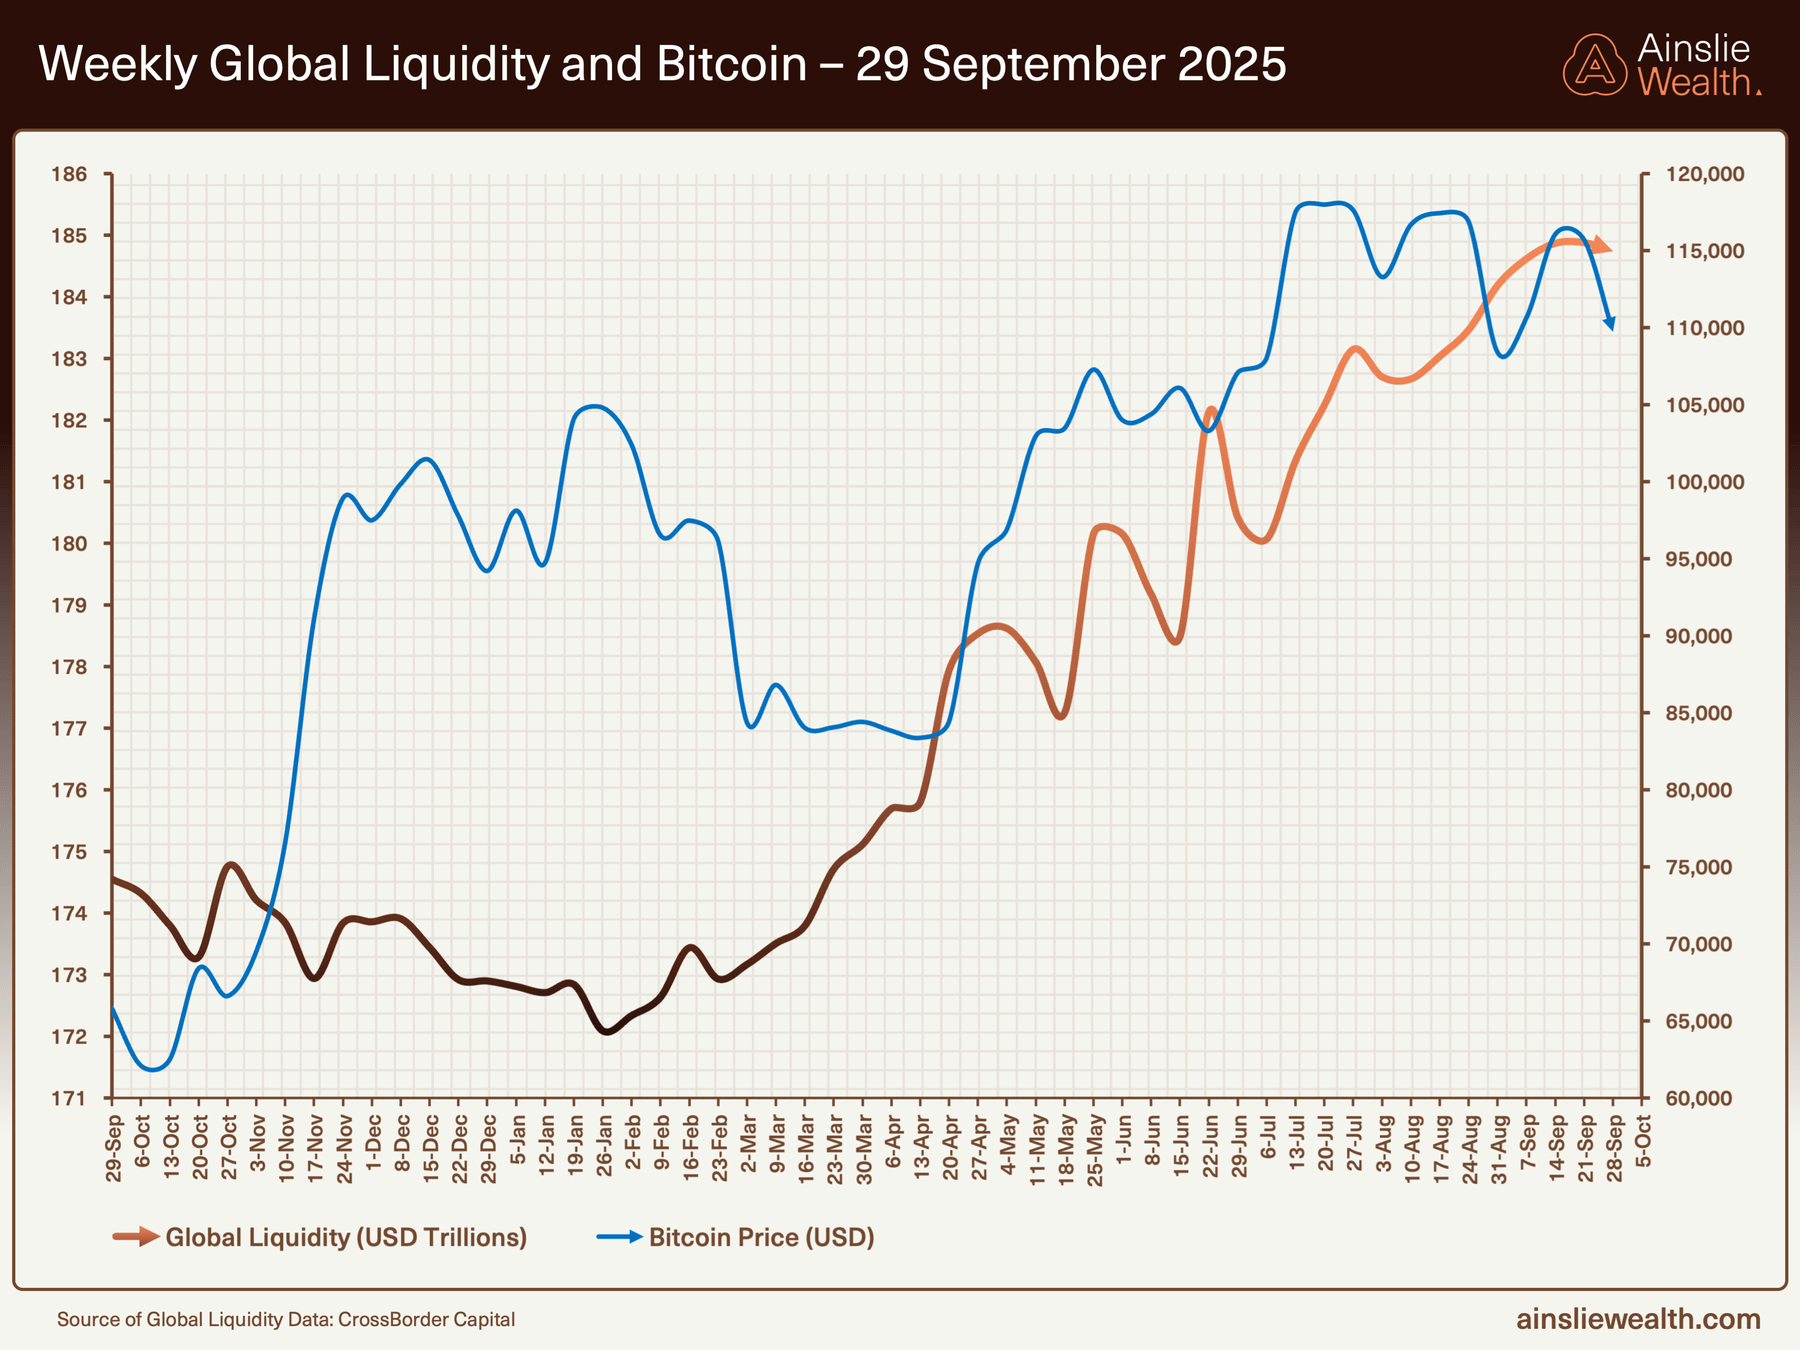
Global liquidity continues to demonstrate uneven progression, with seasonal factors contributing to a recent flattening in nominal levels, though year-over-year comparisons reveal sustained elevation. Developed markets lead the contributions, while emerging economies, particularly China, show inconsistent alignment, which could unlock additional gains amid anticipated dollar depreciation and interest rate reductions. Rate-of-change metrics have moderated in line with expected softening through August and September, yet parallels to the 2016-2017 cycle suggest scope for a concluding expansionary surge. Supported by declining bond market volatility and stable collateral values, this backdrop favours short-term asset growth, albeit with caution for any rapid escalation that might herald the cycle's apex.


Deep dive on the Global Macro Cycle
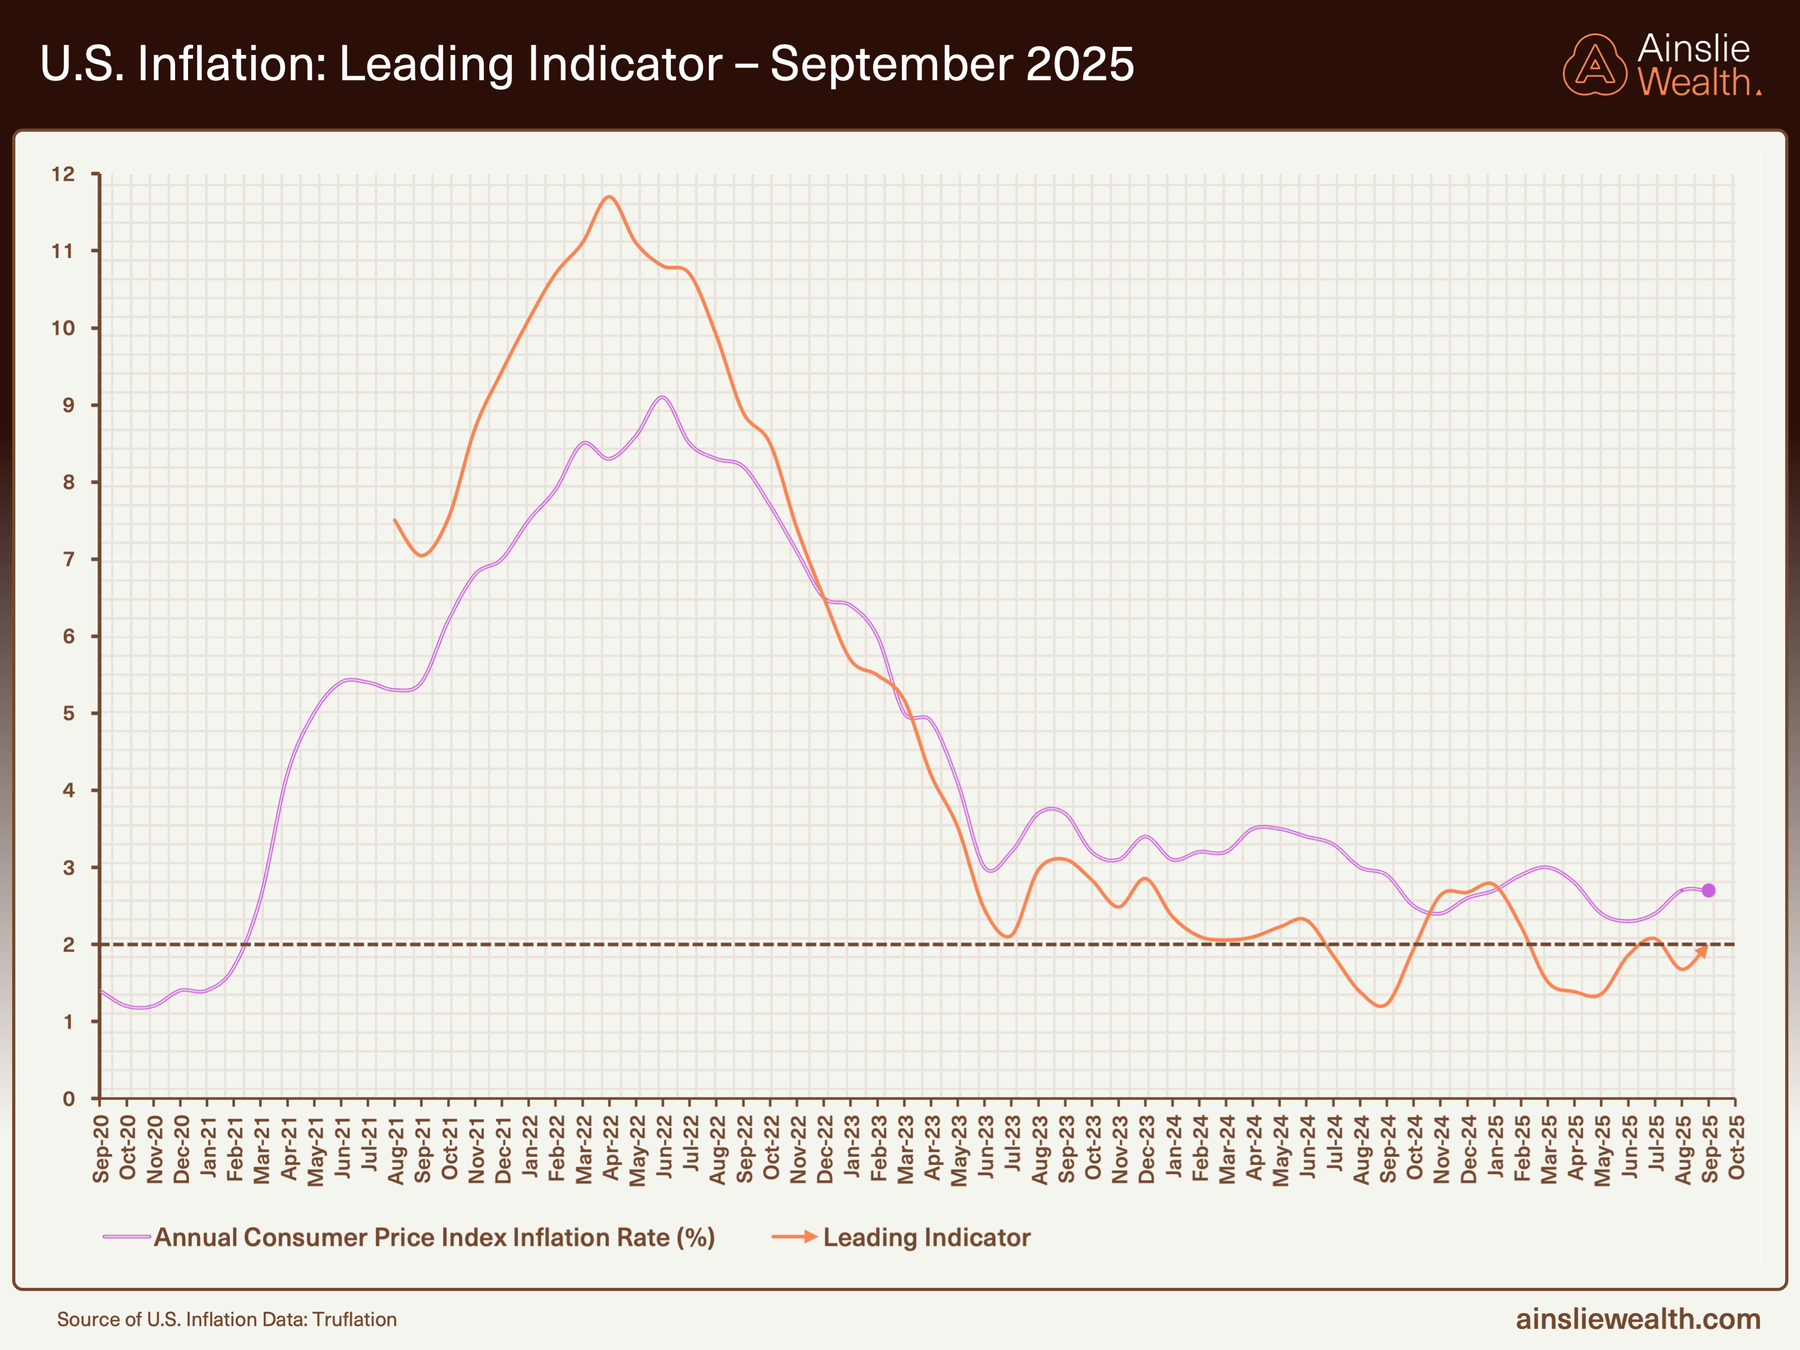
The macro cycle exhibits gradual advancement, with growth signals stabilising near neutral across manufacturing and services sectors, bolstered by fiscal initiatives as central banks pivot from inflation management toward mitigating employment pressures. Inflation trajectories persist downward overall, with risks of transient deflation if softness endures, facilitating policy easing that may prolong the cycle without swift reacceleration. Bond market responses to recent guidance affirm expectations of contained inflation, while employment data revisions could hasten accommodative measures. This arrangement points to an extended early-to-mid phase, likely postponing substantial inflationary upturns until around 2026, when intensified quantitative easing might restore conventional cycle dynamics.


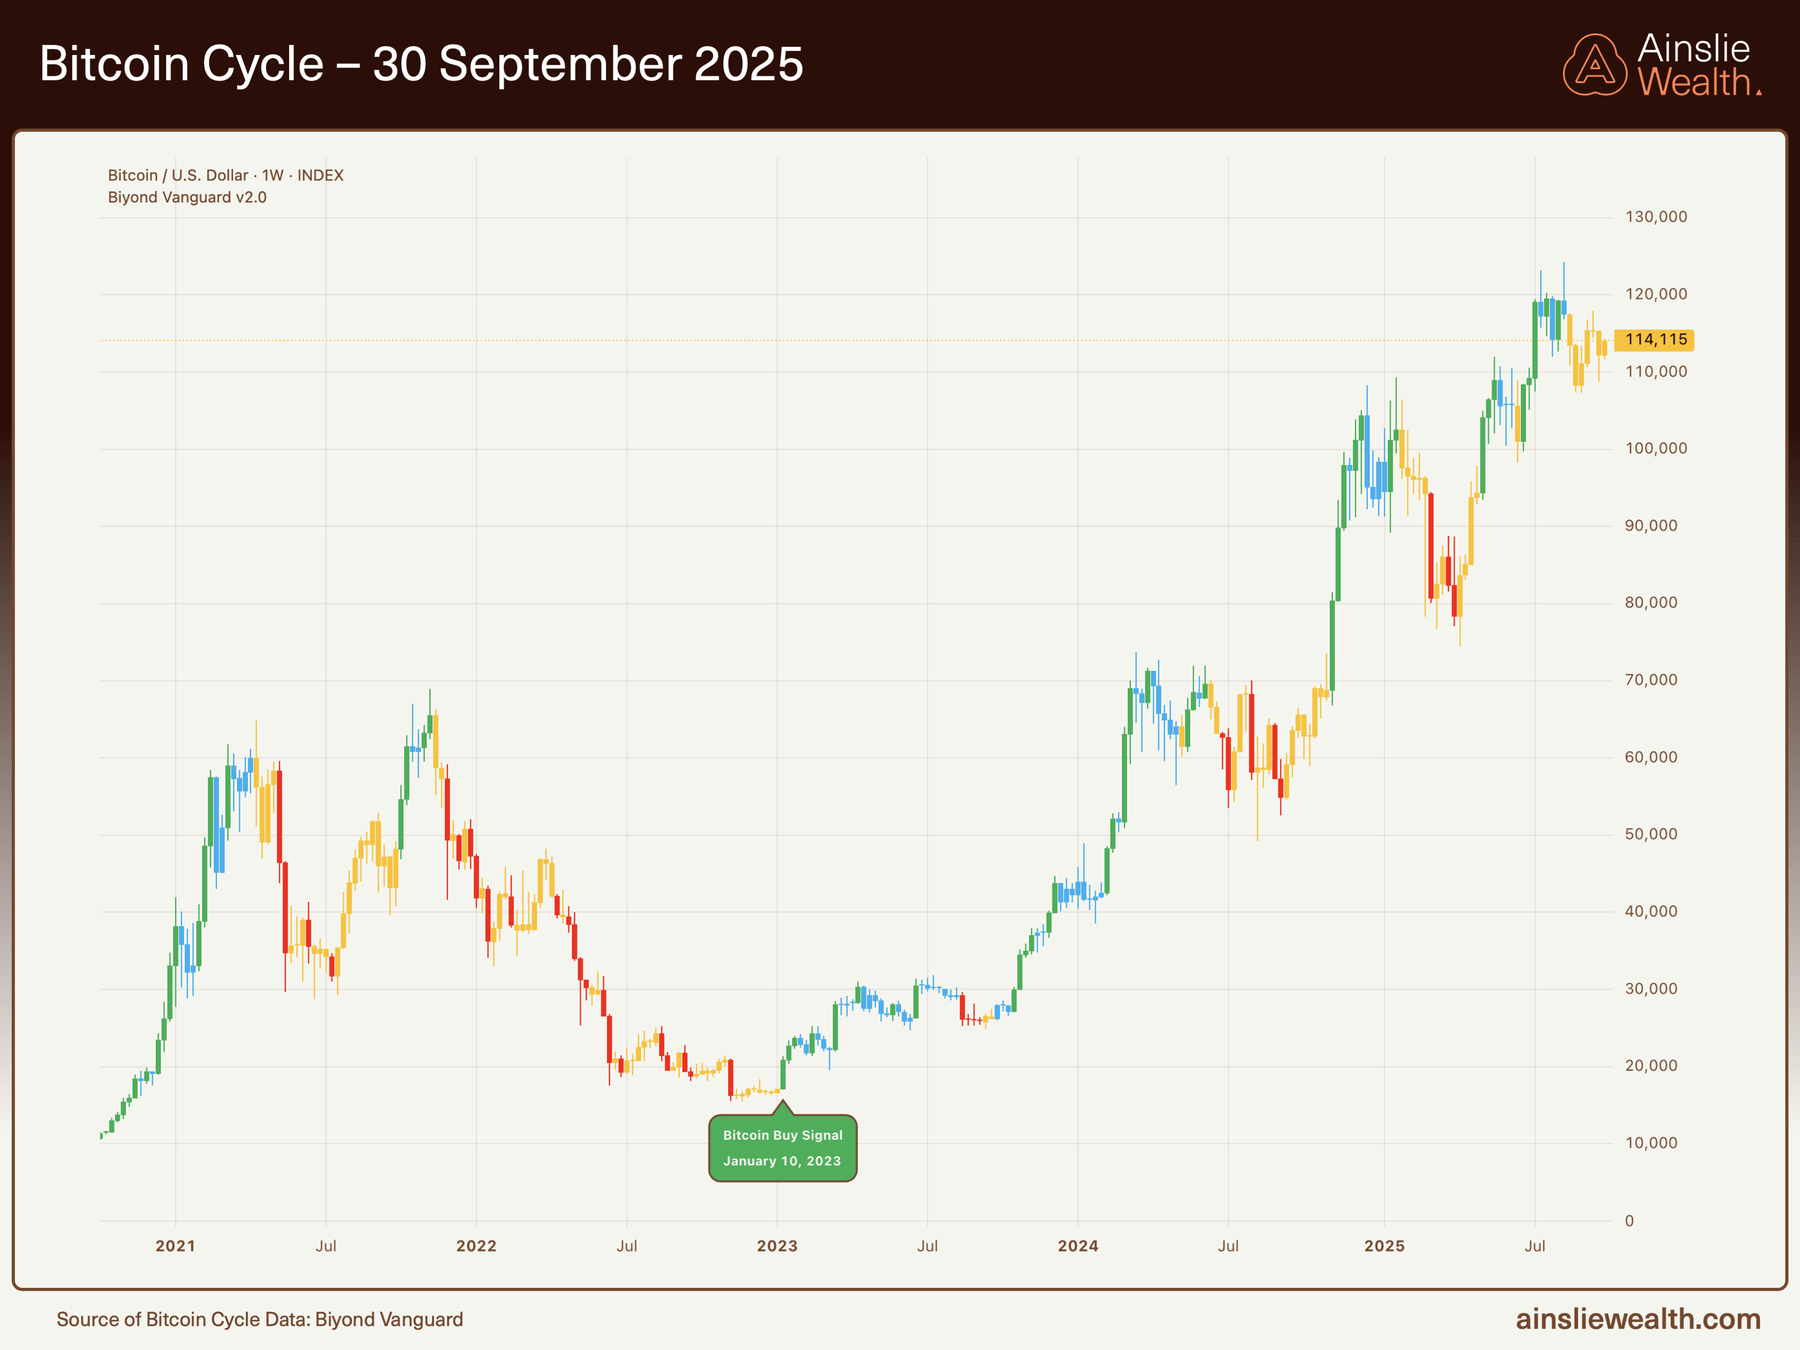
Deep dive on the Bitcoin Cycle
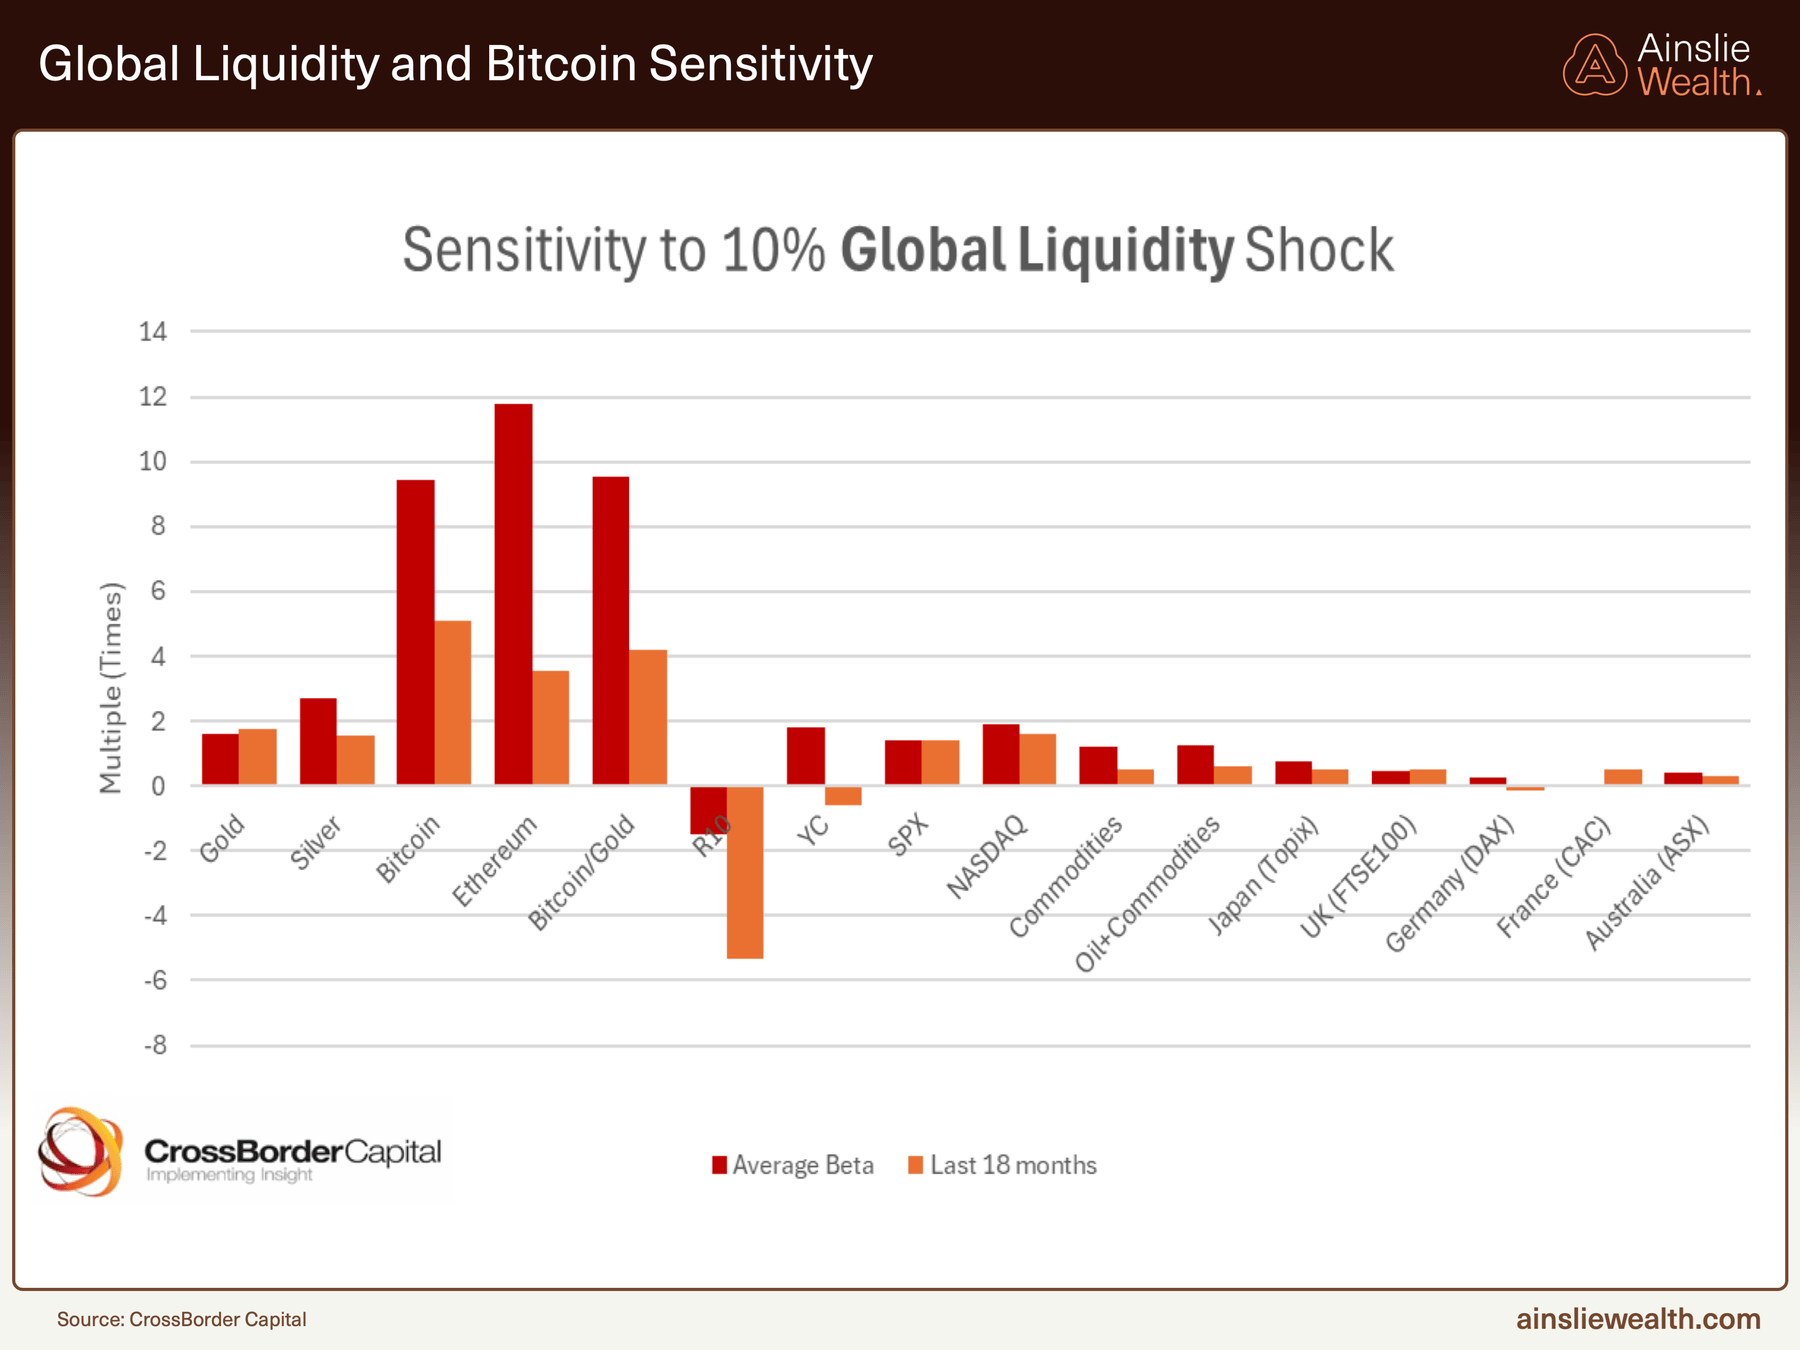
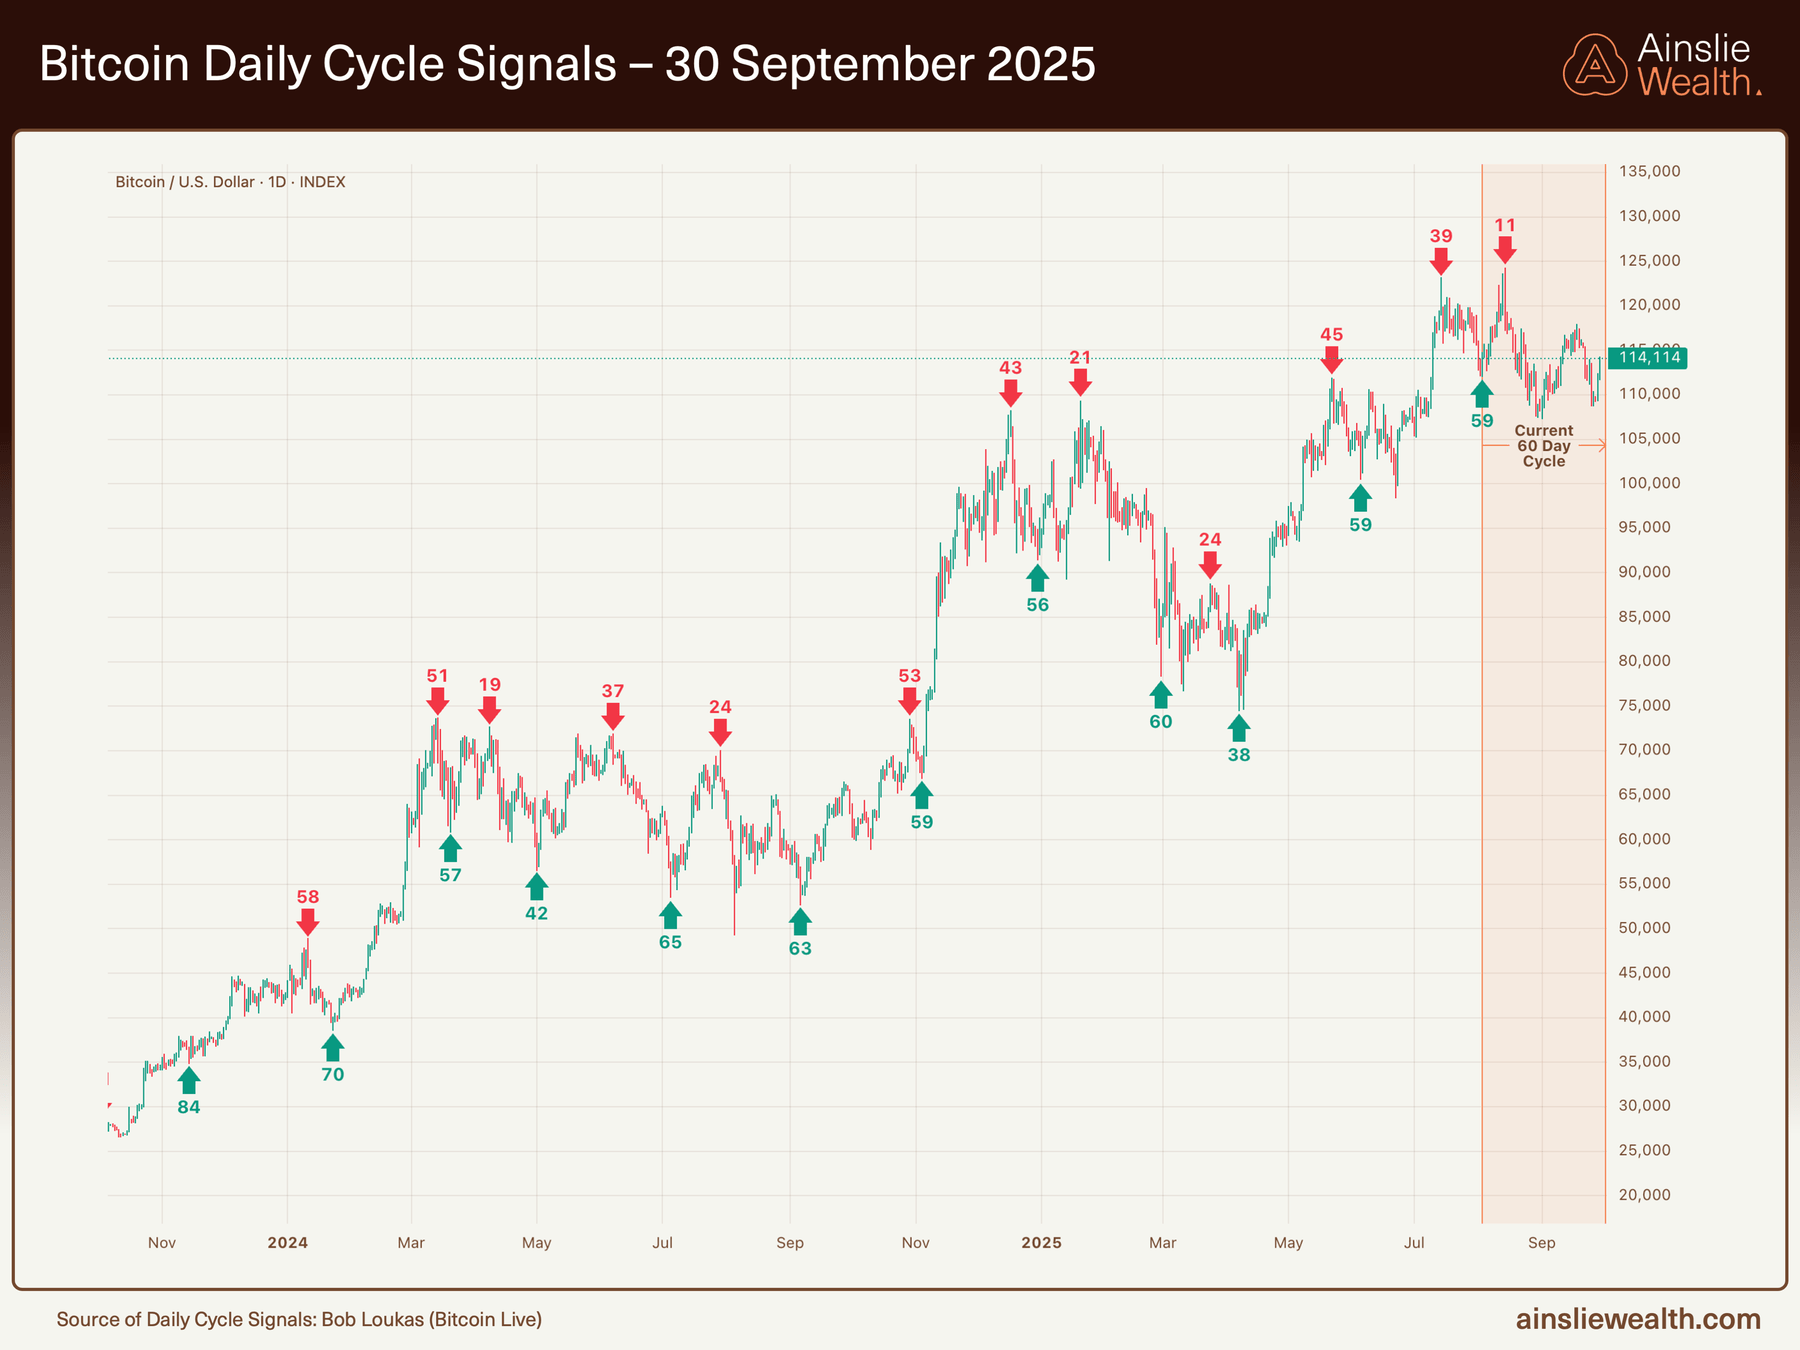
Bitcoin maintains its linkage to liquidity patterns, though recent momentum dips have raised flags, which broader macro evaluations frame as accumulation opportunities rather than terminal declines. Positioning metrics reveal increasing short interest, while the asset's responsiveness to liquidity rate changes highlights the need to track volatility near highs. Cycle projection tools indicate emerging lows, with resumption of upside likely commencing in October, presenting enhanced prospects for upward momentum and advocating for strategic dollar cost averaging during range-bound periods to capitalise on potential rallies. As the cycle continues to mature, focus intensifies on sentiment and leverage hazards, amid expectations of heightened volatility in the latter stages.


Gold and Silver
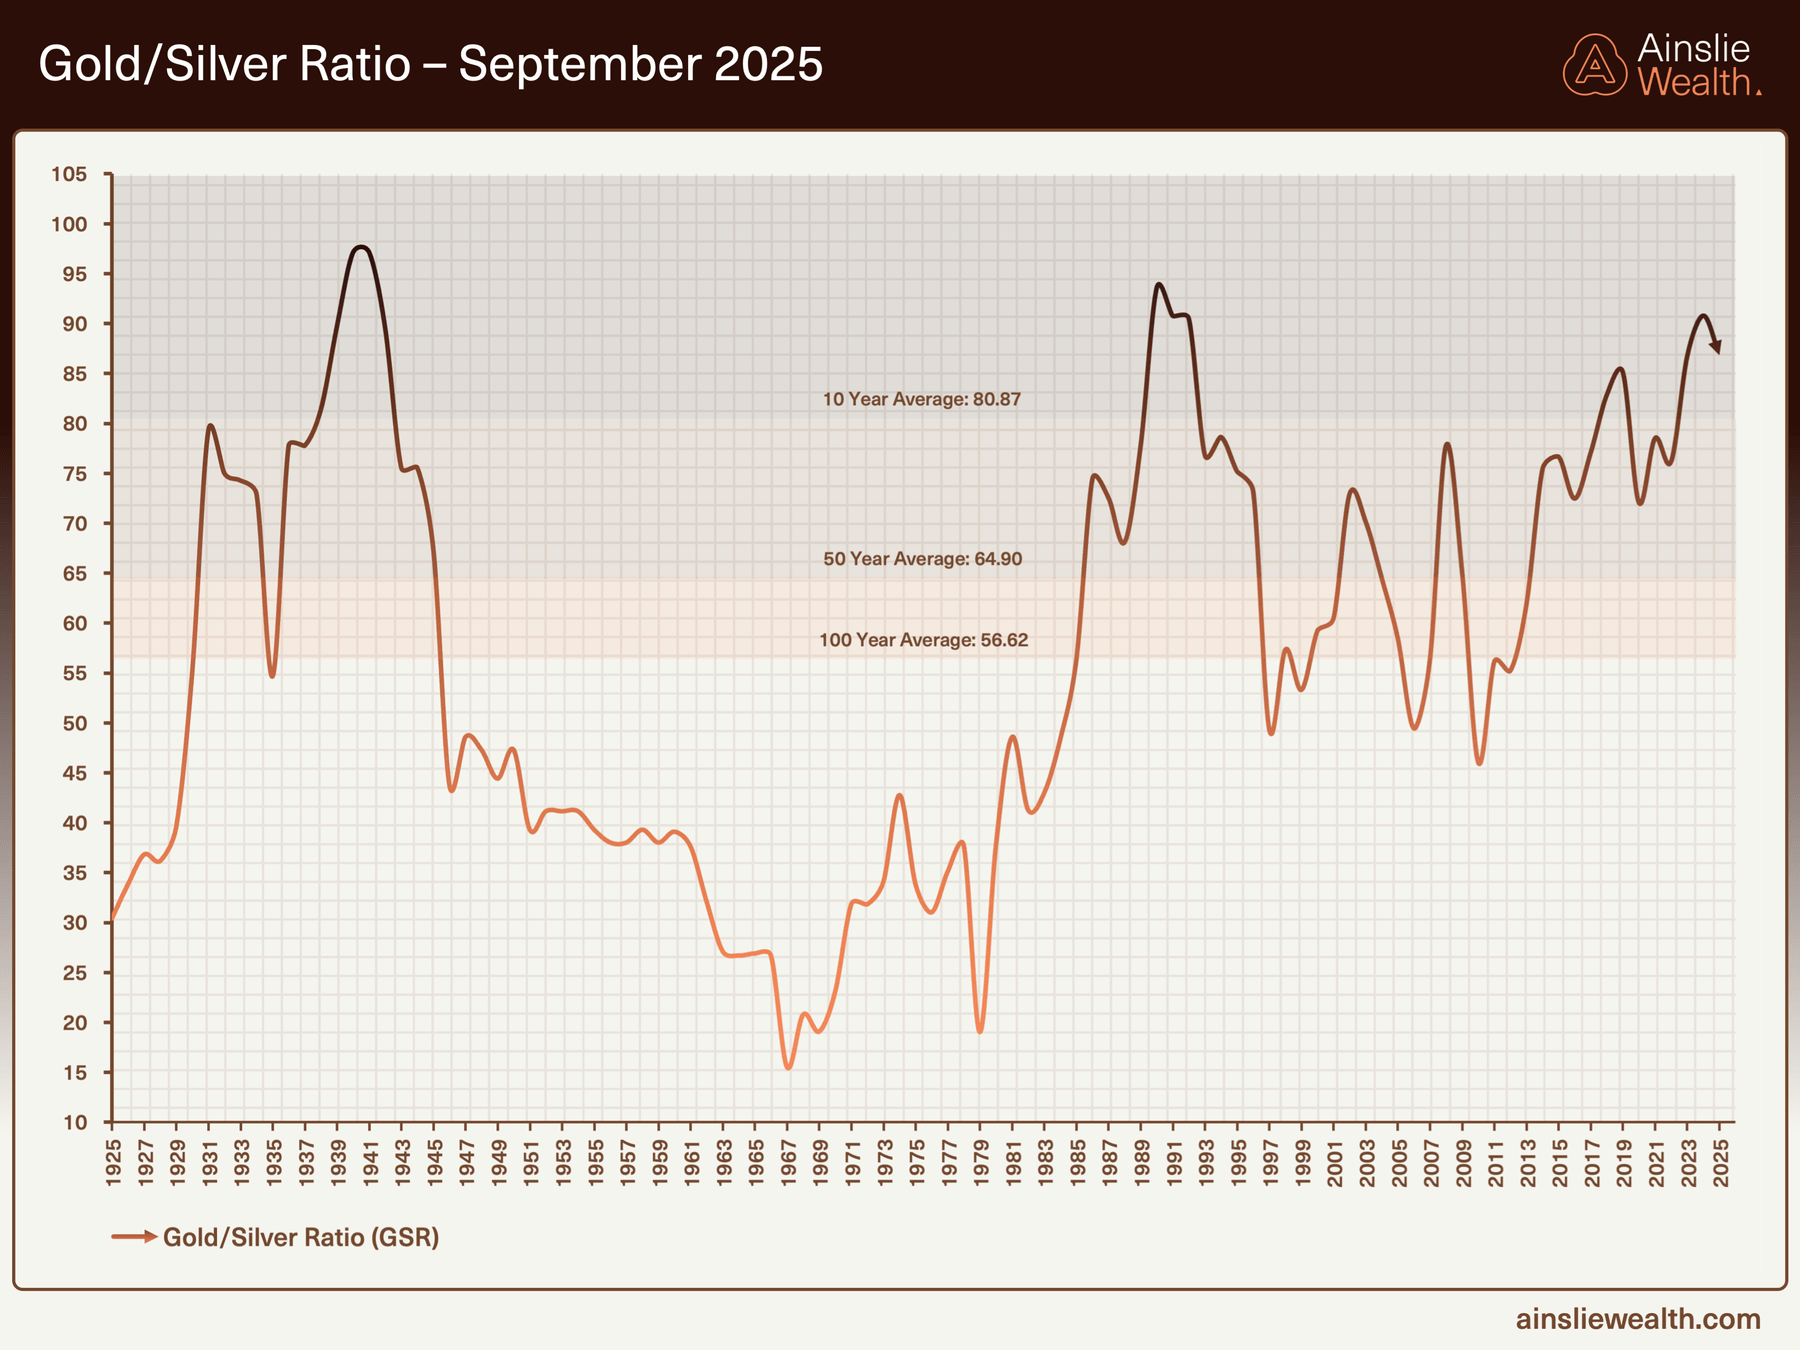
We can take advantage of the Macro Cycles by strategically allocating between the Macro Assets (Bitcoin, Gold, and Silver) during the optimal cycle stages.
Strategic allocation across macro assets like Bitcoin, gold, and silver leverages cycle phases for optimised performance, with gold consolidating at high levels and silver delivering superior percentage advances, underpinned by industrial applications and mining sector strength, indicating further potential. The gold-to-silver ratio's downward trajectory supports silver's near-term favour, likely compressing further toward any macro peak before a brief reversal during safety-seeking flows. Over extended 80-year horizons, silver appears poised for prolonged outperformance with the GSR having plenty of room to keep moving lower. This dynamic thrives in liquidity expansions, with silver's amplified sensitivity positioning it for outsized gains as the cycle evolves toward possible culmination in 2026.

A Simple Trading Plan to take advantage of the cycles
Watch the video presentation to see full details of the specific Trading Plan we provide, that you can follow, which has returned 203.2% p.a. as at Tuesday’s recording.
Watch the full presentation with detailed explanations and discussion on our YouTube Channel here:
We will return in October to assess what has changed and keep you updated with everything you need to know. Until then, good luck in the markets!
Chris Tipper
Chief Economist and Strategist
The Ainslie Group
x.com/TipperAnalytics
Note: The monthly video presentation is recorded live with our expert panel. Our objective is to make the updates as useful and specific to what you want to understand as possible, so as always feel free to reach out with any questions or feedback that we can incorporate into next month’s video to make it something that provides you with the highest possible value for your time!