
Bitcoin Analysis: Beyond the Block – October 2025
Disclosure
This article is intended solely as general commentary on global markets and does not constitute personal financial advice. The content presented is based on current information and opinions, and may change without notice. Readers should not rely on any information in this publication when making investment decisions but instead should seek professional advice tailored to their own circumstances. In addition, any recommendations or views expressed herein may conflict with the allocation strategy or holdings of the Ainslie Bitcoin & Bullion Fund.
Today the Ainslie Research team brings you the latest monthly update on Bitcoin – including the Macro fundamentals, market and on-chain technical metrics and all of the other factors currently driving its adoption and price. This summary highlights some of the key charts that were discussed and analysed by our expert panel. We encourage you to watch the video of the presentation in full for the detailed explanations.
Bitcoin and Global Liquidity
Bitcoin is the most directly correlated asset to Global Liquidity. Trading Bitcoin can be thought of as trading the Global Liquidity Cycle, but with an adoption curve that leads to significantly higher highs and lows each cycle. As such we look to buy Bitcoin during the ‘Bust’ phase or liquidity low, then rotate out of it during ‘Late Cycle’ where liquidity is over extended and downside protection is required (our preference is to rotate into Gold). When correctly timing and structuring the rotation, it is possible to significantly outperform ongoing monetary debasement. The Bitcoin cycle low was in November 2022, and since then the returns have been unmatched by any other major asset.
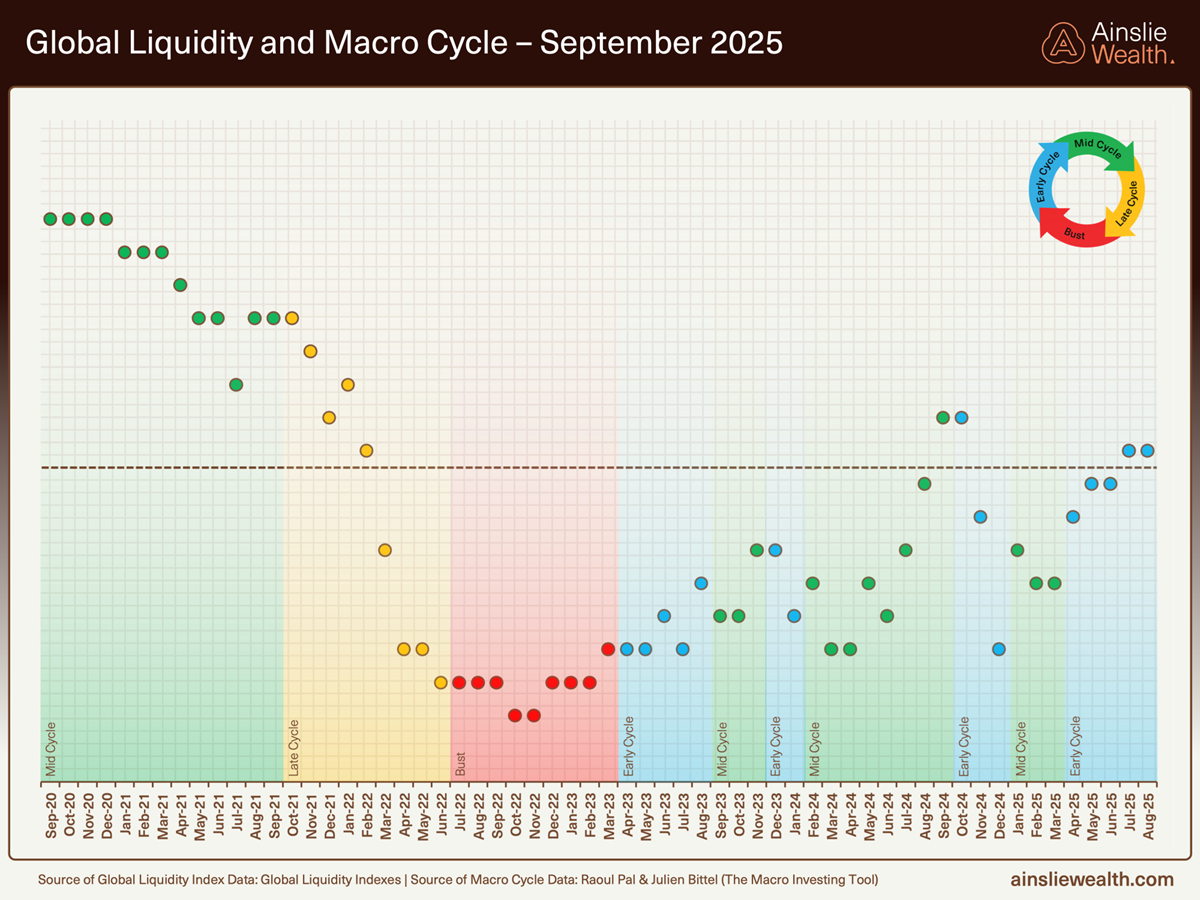
Where are we currently in the Global Macro Cycle?
Welcome to the October edition of Beyond the Block. For those who also follow our Beyond the Block podcast on YouTube, you’ll already be familiar with our new offering—the Ainslie Bitcoin Bullion Fund. This wholesale managed fund actively allocates between Bitcoin, gold, and silver, aiming to deliver strong capital growth while mitigating downside risk through precious metals during Bitcoin drawdowns. Our dynamic investment strategy is directly guided by the macro and liquidity cycles covered in Beyond the Block, forming the core of the Fund’s investment framework and asset allocation decisions.
If you qualify as a wholesale investor and would like to learn more about the Ainslie Bitcoin & Bullion Fund, visit our official information page at https://www.ainsliewealth.com/ainslie-bb-fund.
Currently, we sit in an 'Early Cycle' macro regime, potentially nearing transition into 'Mid Cycle'. To clarify:
Early Cycle: Economic growth accelerates while inflation is subdued or declining.
Mid Cycle: Both economic growth and inflation are rising.
Despite the age of this cycle (which began in March 2023), data suggests it is not yet time to move away from risk assets. Let’s explore the key dynamics across growth, inflation, and—most critically—liquidity.
Growth and Inflation
The U.S. ISM Services PMI stalled at 50 in September, indicating no growth. Business activity, new orders, and inventories weakened, while employment remained in contraction and price pressures rose to multi-year highs. Fewer industries are reporting expansion, and demand appears fragile, suggesting stagnation across the service sector.
Manufacturing also showed little improvement, with the ISM Manufacturing PMI at 49.1—its seventh straight month below 50. This indicates ongoing contraction in new orders, hiring, and export demand, despite easing input costs and modest production upticks. Overall, both major sectors are showing synchronised weakness.
These benign PMI readings suggest the U.S. economy is treading water rather than entering outright recession or recovery. Politically and economically, this places pressure on fiscal policy to do more, especially as monetary tools lose traction. We expect to see more direct fiscal stimulus or infrastructure investment—although rising debt servicing costs and market volatility will need to be carefully managed.

Inflation in the U.S. has started edging higher, indicating the bottom may be in. This is not yet a concern, given our current position in the macro cycle. A rising inflation rate becomes more significant later in the cycle, when its pace accelerates.

Where are we currently in the Global Liquidity Cycle?
Historical data since 1970 illustrates how global liquidity cycles drive financial markets. When liquidity is scarce, we often see currency crises, banking stress, or broader financial instability. Conversely, abundant liquidity tends to fuel asset booms.
Central banks and governments attempt to smooth these cycles by adding liquidity during deflationary downturns and withdrawing it during asset bubbles. However, we would argue that rather than smoothing the cycle, these interventions have often exacerbated volatility. That said, these cycles present clear opportunities when trading assets like Bitcoin.

In today’s fiscal-dominated environment, owning real assets is essential for building and preserving wealth. It’s crucial to recognise that asset prices move in step with global liquidity, not CPI. Central bank injections push up asset prices long before inflation shows in consumer data. CPI, a lagging and partial indicator, fails to capture the broader monetary expansion seen in balance sheets, credit, and money supply.
When global liquidity expands, it first impacts financial assets—not groceries. So, even if CPI appears tame, the inflation of asset prices continues in real time. That includes equities, real estate, gold, and of course, Bitcoin.
Sitting on cash while liquidity flows into scarce assets is a losing proposition. Liquidity chases returns, and that’s where wealth compounds. Owning scarce assets isn’t just defence—it’s the best offence in a policy-driven world returns.

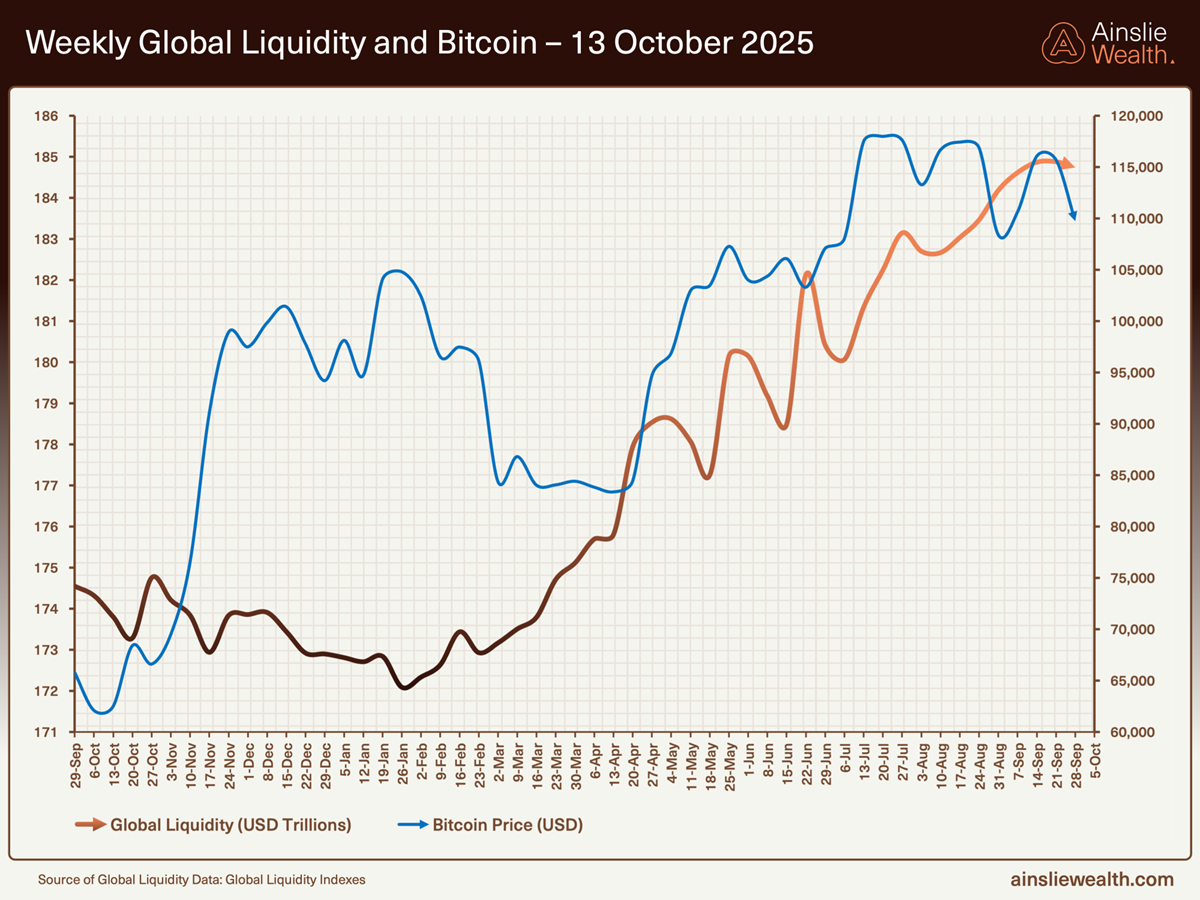
Bitcoin and the Liquidity Slowdown
The 12-month rate of change in liquidity has slowed to 6% year-on-year. While still healthy, this deceleration has weighed on Bitcoin in recent weeks. Bitcoin has struggled to break above all-time highs, even as other assets—gold, silver, and equities—have reached new ones. Although frustrating, we expect this rate of change to pick up into Q4, creating a more constructive environment for Bitcoin.

Our main concern is the lack of central bank appetite for new liquidity injections. As of September, U.S. Federal Reserve liquidity has declined significantly, with the Fed Liquidity Index falling to 51.2 from 64.9 earlier in the year. This contraction is largely due to rebuilding the Treasury General Account and ongoing resistance to expanding the Fed’s balance sheet. While Treasury issuance and fiscal monetisation provide some offset, domestic liquidity growth is slowing.
In contrast, the People’s Bank of China has added nearly US$1 trillion in liquidity since early 2025. This stimulus is aimed at reviving economic activity and managing China’s large debt load. Tools include reverse repos, medium-term lending, and adjustments to bank reserve ratios. This liquidity has boosted demand for real assets and lifted Chinese equities, all while maintaining currency stability during USD weakness.
After a 36-month uptrend beginning in late 2022, global central bank liquidity is now at a turning point. Many central banks, especially in the US and Europe, are pausing or reversing easing. While China’s easing offers some offset, the broader trend raises risks of volatility and potential stress in funding markets.

Treasury QE and Collateral Mechanics
The main driver of U.S. liquidity has shifted from Fed QE to Treasury QE—specifically, large-scale issuance of short-term bills and coupons. These are quickly absorbed by banks and institutions, forming the backbone of the repo and collateral markets.
Treasury securities serve as pristine collateral for global lending and liquidity flows. Around 80% of global lending is underpinned by bond collateral, so any instability here has systemic implications. Treasury QE is directing liquidity more toward the real economy, but also increases the risk of instability if repo or collateral markets seize up.
Today’s liquidity expansion is increasingly powered by fiscal policy, private credit, and cross-border capital flows rather than direct central bank QE. If Fed liquidity continues to contract and reserves fall below safe thresholds, systemic risks could escalate, potentially forcing the Fed to re-intervene.
Bitcoin IS the Hurdle Rate
On a recent Saturday, the crypto market experienced one of its most severe liquidation events, with US$19–20 billion in leveraged positions wiped out in 24 hours. Over 1.6 million traders were impacted, and Bitcoin saw sharp declines as liquidity vanished across the board.
Altcoins were hit hardest. Many dropped precipitously, with some momentarily going "no bid," exposing fragilities in market structure. In moments of stress, capital flees to the deepest, most liquid markets—and Bitcoin remains the clear safe haven within crypto.

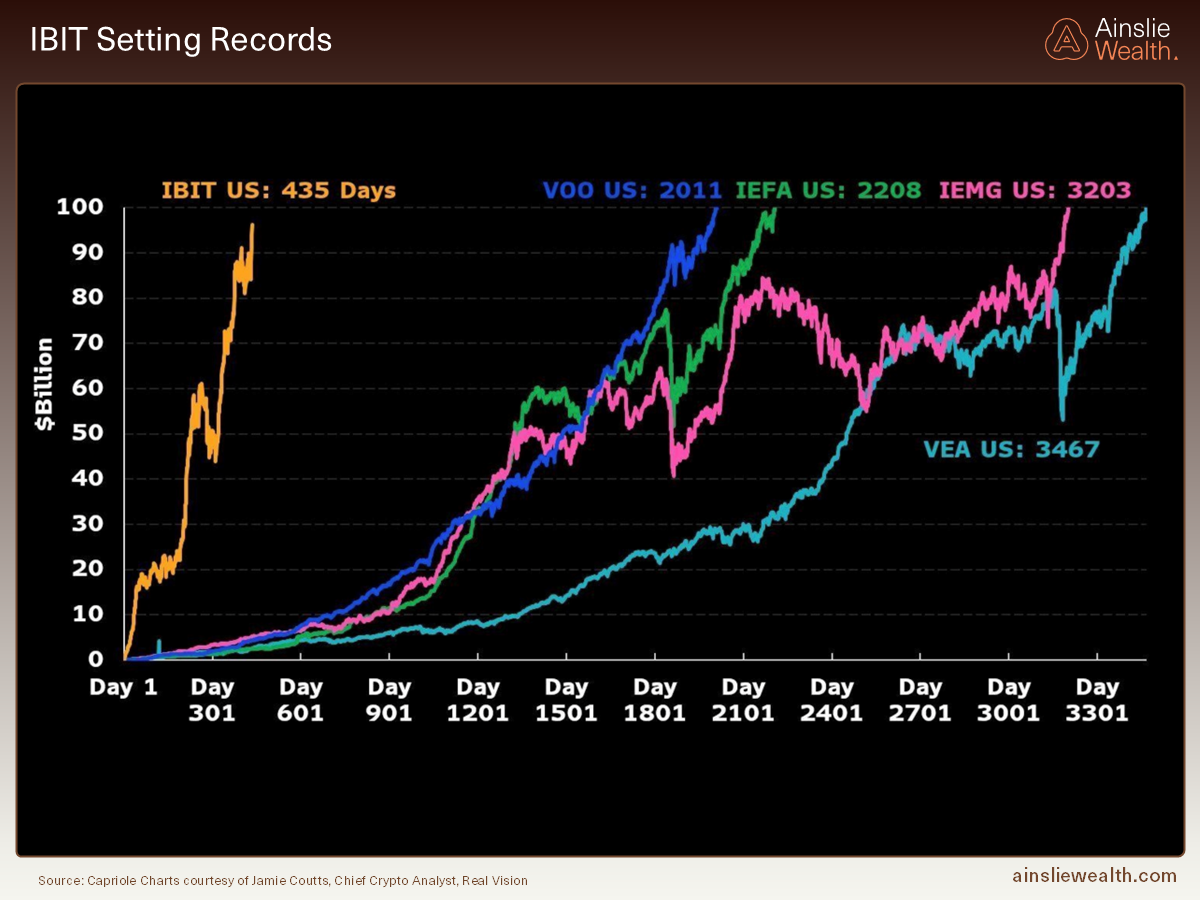
Bitcoin’s liquidity has deepened with rising institutional adoption and growth in regulated vehicles like spot ETFs. As of 14 October, U.S. spot Bitcoin ETFs held over US$157 billion in assets, with BlackRock’s IBIT alone nearing US$100 billion. Over 59% of institutional investors now allocate at least 10% to digital assets, primarily Bitcoin. These flows have reduced volatility and provided meaningful price support, with ETF products now warehousing 18% of total BTC supply.
BlackRock’s IBIT has become its most successful ETF ever, generating over US$245 million in annual revenue and reaching this scale faster than any ETF in history. Fidelity’s FBTC has also grown rapidly, now at US$24 billion in AUM.
Seasonal strength is another tailwind. Bitcoin has closed higher in nine of the last ten Octobers, with an average return of 21.4%. Q4 is historically Bitcoin’s strongest quarter, averaging 59.6% returns. This is driven by portfolio rebalancing, increased institutional allocations, year-end policy shifts, and a weaker USD.

Since 2020, while inflation, equities, and real assets have surged, Bitcoin has gained over 1,600%.

Bitcoin, Liquidity & the Shifting Macro Cycle
Bitcoin’s path through 2025 continues to reflect an evolving liquidity landscape and shifting macroeconomic cycles. The current environment can be broadly described as ‘Early Cycle’—characterised by accelerating growth and subdued inflation—but we’re now seeing early signs of a transition towards a ‘Mid Cycle’ phase, where both growth and inflation may rise together.
Recent softness in key U.S. PMI data points to broad stagnation rather than outright contraction. Policymakers face a delicate balancing act: supporting growth through direct fiscal stimulus while contending with rising debt servicing costs. Inflation appears to have bottomed and is edging higher, though at this stage, a modest rise is more indicative of macro resilience than cause for immediate concern.
Liquidity remains the key driver. The Federal Reserve has wound back quantitative easing, reducing domestic liquidity, while the U.S. Treasury has stepped in with large short-term debt issuance—supporting repo and collateral markets, but introducing new systemic risks. Meanwhile, China’s PBOC has launched aggressive stimulus measures, injecting nearly US$1 trillion into its economy. This has bolstered demand for real assets and supported Chinese equities, without putting undue pressure on its currency.
On the whole, global liquidity continues to rise, though its composition is shifting. Fiscal policy, private sector credit, and cross-border capital flows are playing a greater role as central banks pause or reverse earlier easing. If U.S. liquidity contracts further and bank reserves fall below critical thresholds, money markets may face renewed volatility—potentially forcing policymakers to act with fresh interventions.
For Bitcoin, this regime has presented near-term headwinds. Price growth has stalled below previous highs, with year-over-year expansion slowing to 6%. Still, underlying fundamentals remain solid, and conditions appear set to improve into Q4. A pickup in the rate of change could provide a more favourable backdrop for price action.
Finally, corporate Bitcoin adoption continues to accelerate. As of Q3 2025, total corporate holdings surpassed 1.02 million BTC—nearly 4.9% of the total supply—marking a 20.9% increase from last quarter. The value of these holdings now exceeds $117 billion, driven by both price appreciation and broader participation. A total of 172 public companies now hold Bitcoin on their balance sheets, up 38.7% from the previous quarter. This growing institutional presence further reinforces Bitcoin’s emerging role as a strategic corporate asset in today’s evolving macro environment.

Watch the full presentation with detailed explanations and discussion on our YouTube Channel here:
Until we return with more analysis next month, keep stacking those sats!
Joseph Brombal
Research and Analysis Manager
The Ainslie Group