
Bitcoin Analysis: Beyond the Block – November 2025
Today the Ainslie Research team brings you the latest monthly update on Bitcoin – including the Macro fundamentals, market and on-chain technical metrics and all of the other factors currently driving its adoption and price. This summary highlights some of the key charts that were discussed and analysed by our expert panel. We encourage you to watch the video of the presentation in full or the detailed explanations.
Bitcoin and Global Liquidity
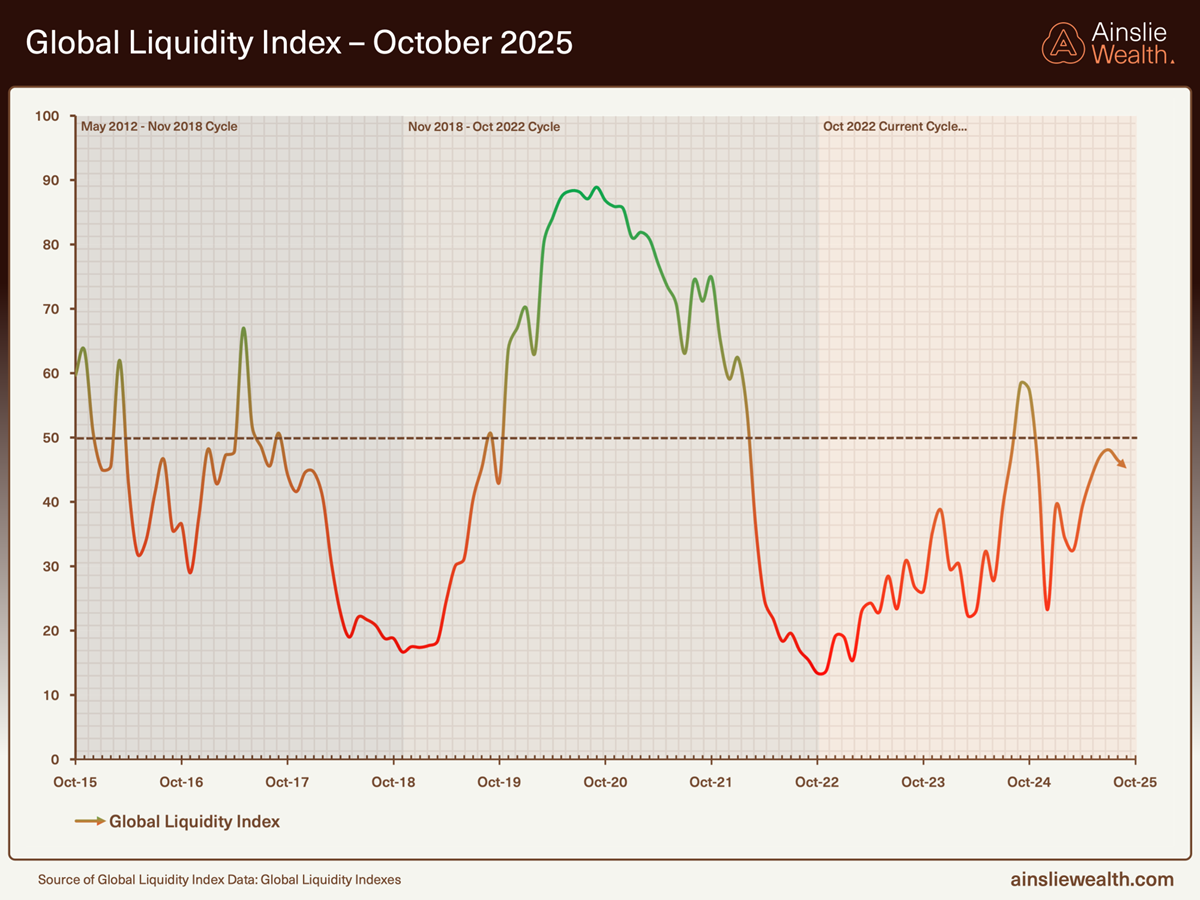
Bitcoin is arguably the asset most directly correlated with global liquidity. In many respects, trading Bitcoin is akin to trading the global liquidity cycle — only overlaid with an adoption curve that produces increasingly higher highs and deeper lows with each iteration.
We look to accumulate Bitcoin during the ‘bust’ phase, or liquidity trough, and rotate out during the ‘late cycle’, when liquidity is stretched and capital preservation becomes the priority (with gold being our preferred destination). When timed and structured effectively, this rotation strategy has the potential to meaningfully outperform the effects of ongoing monetary debasement.
The last major cycle low for Bitcoin was in November 2022 — since then, its performance has outstripped that of all major asset classes.
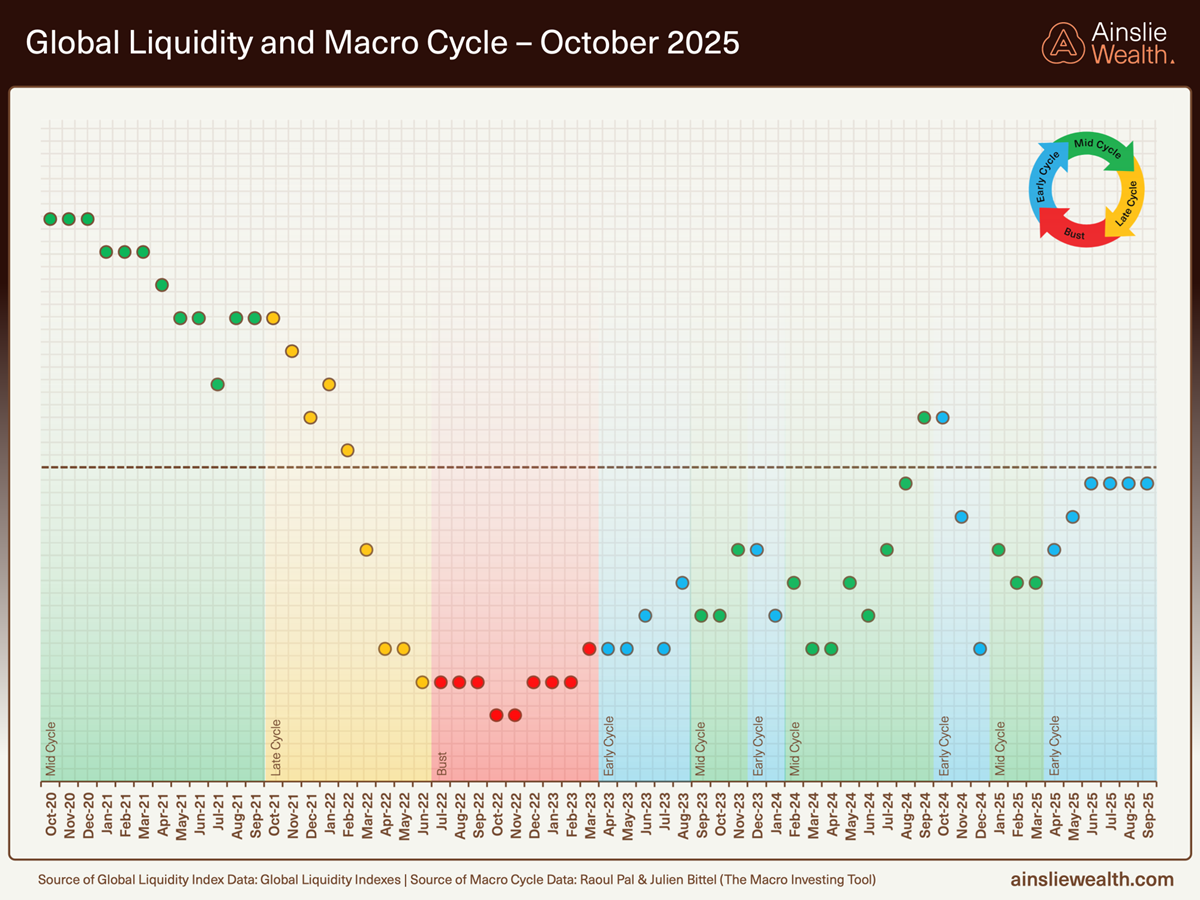
Where are we currently in the Global Macro Cycle?
Welcome to the written edition of Beyond the Block for November. If you also tune into our podcast on YouTube, you’ll be familiar with the Ainslie Bitcoin & Bullion Fund — our new wholesale managed fund that dynamically allocates between Bitcoin, gold, and silver. The Fund seeks strong capital growth, while also managing downside risk by pivoting into precious metals during Bitcoin drawdowns.
Its dynamic strategy is grounded in the macro and liquidity cycle framework discussed in Beyond the Block, which underpins our investment philosophy and allocation decisions.
If you qualify as a wholesale investor and would like to learn more about the Ainslie Bitcoin & Bullion Fund, visit our official information page at https://www.ainsliewealth.com/ainslie-bb-fund.
At a macro level, we remain positioned in the early cycle, though we hold high conviction that the shift to mid cycle is nearly complete. That said, the Bitcoin cycle framework has become less definitive, with some signals sending mixed messages. While the macro environment still supports risk assets, the liquidity cycle is beginning to show signs of fatigue, and the source of the next global liquidity wave remains unclear.
Let’s dive into the details.
Key Macro Signals
This month, we turn our attention to the US, where much of the macro debate is centred. Long-time readers will know we’ve been anticipating a rebound in the US Purchasing Managers’ Index (PMI) for some time — but it has yet to materialise. The current stretch of PMI contraction has lasted at least 16 consecutive months — not far off the historical record of 18 — highlighting just how uncertain and atypical this cycle is compared with previous decades.
In response, government stimulus has shifted focus from ‘Wall Street’ to ‘Main Street’. While this approach may ultimately lift PMIs by boosting household cash flow, it also introduces renewed inflation risks. In the past, stimulus worked through asset markets, with wealth effects lifting PMIs via ‘trickle-down’ mechanics. Now, with quantitative easing receding and a more ‘bottom-up’ policy emphasis, capital is flowing directly into the real economy first, with a more delayed effect on financial markets.
This redirection of policy has emerged as a response to the widening divide of the so-called ‘K-shaped’ economy — where the wealthiest have prospered while inflation steadily chips away at the purchasing power of lower and middle-income households. The result is deepening inequality and a broad drag on consumer spending — a key factor supressing PMIs.

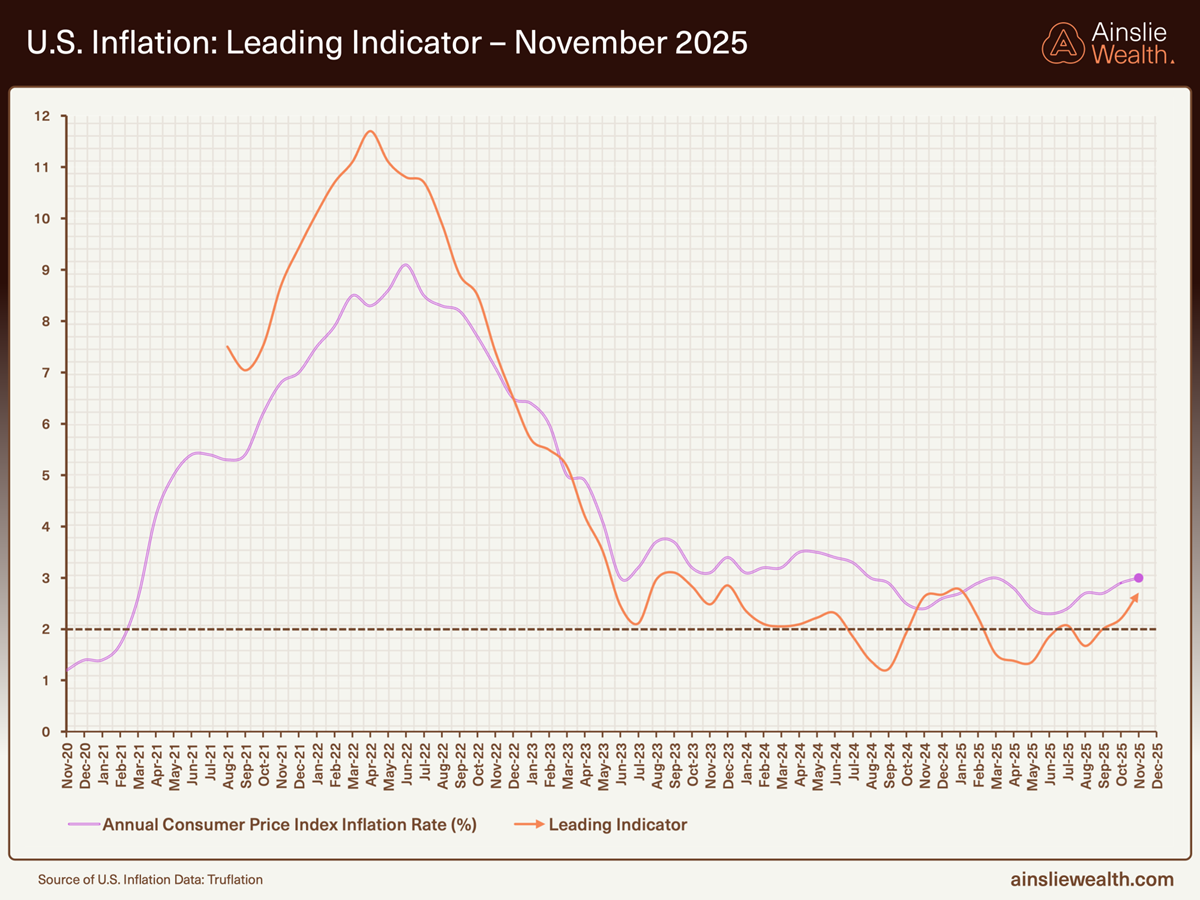
Inflation Outlook and Cycle Progression
Barring a deflationary shock, we believe inflation has decisively bottomed — reinforcing our view that a transition into the mid-cycle is close to inevitable. Continued fiscal stimulus, along with protectionist policies like Trump’s proposed “tariff dividend”, makes a return to the Federal Reserve’s 2 % inflation target increasingly unlikely. For the same reasons, we see the global rate-cutting cycle as far closer to its end than its beginning.
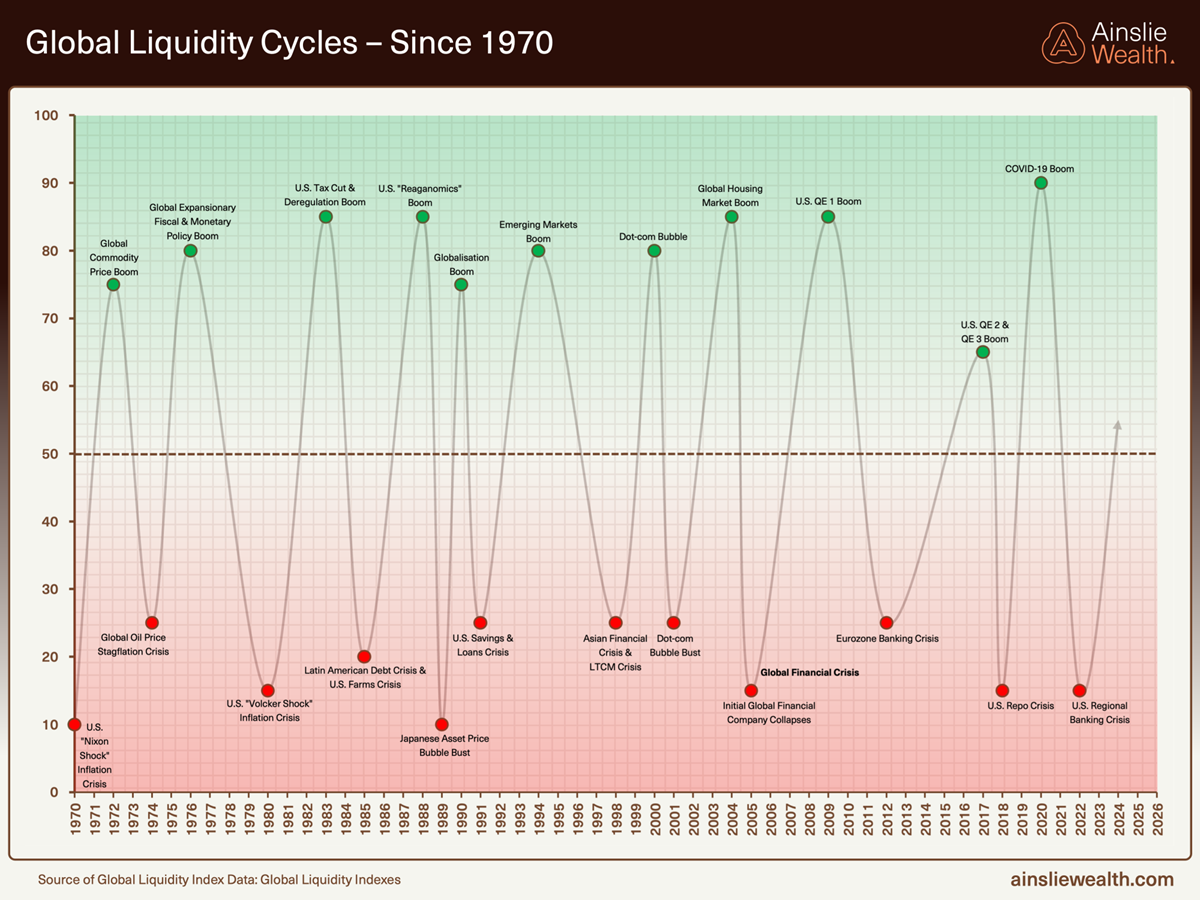
Where are we currently in the Global Liquidity Cycle?
A look at global liquidity cycles since 1970 shows a recurring pattern — periods of contraction often trigger currency, banking, or broader financial crises, while periods of expansion tend to fuel asset price booms.
Governments and central banks routinely attempt to smooth the business cycle by injecting liquidity during deflationary downturns and withdrawing it during asset price surges. Whether these interventions succeed is debatable. In our view, the record suggests failure more than success — but these cycles do create strategic opportunities for investors, particularly in assets like Bitcoin.
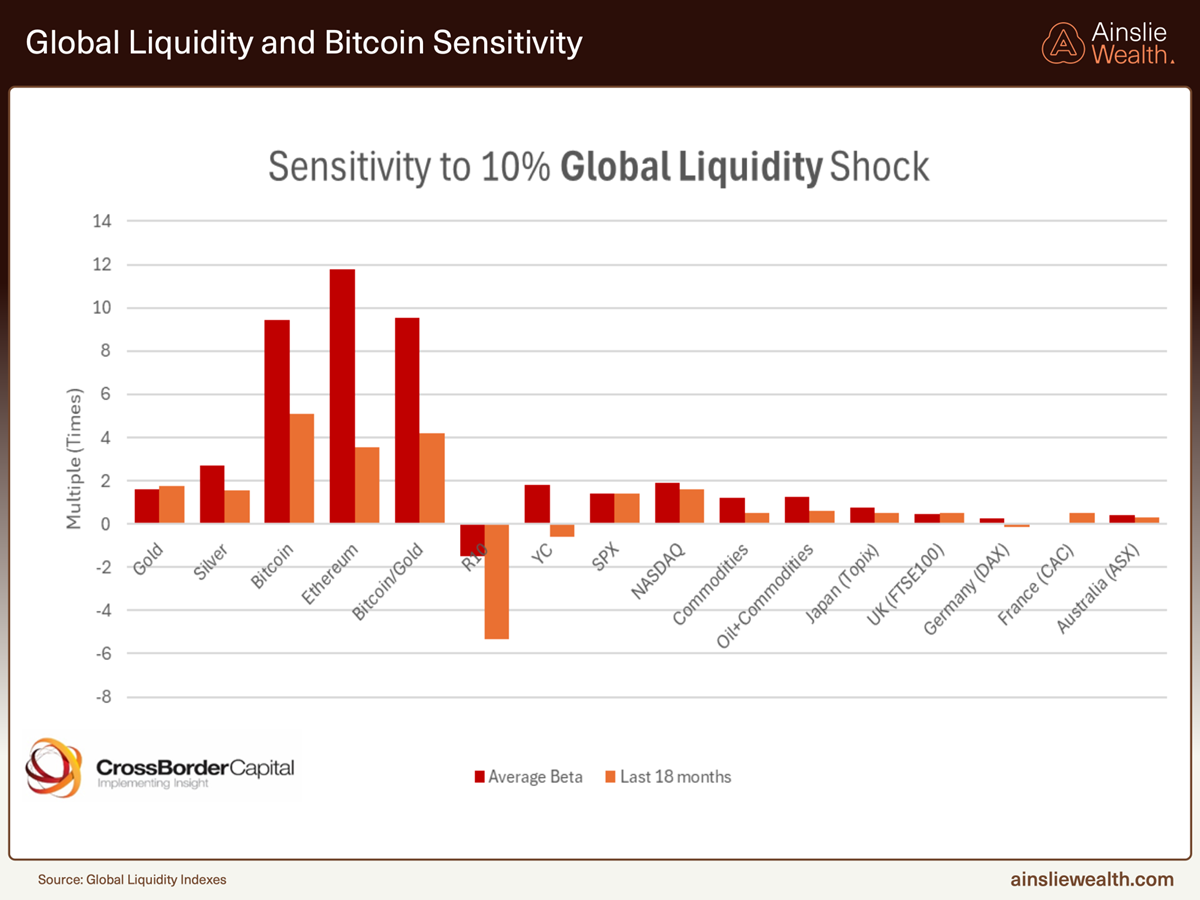
One of Bitcoin’s defining characteristics is its high sensitivity to global liquidity. The “Global Liquidity and Bitcoin Sensitivity” chart reveals that historically, Bitcoin has shown a multiplier effect of up to 9x in response to a 10 % liquidity shock — and around 5x over the past 18 months. That implies a 10 % growth in liquidity could translate to a 50 % price increase for Bitcoin, well above traditional assets such as gold (2x), silver (3x), and equities (S&P 500 at 1x).
This extreme sensitivity gives Bitcoin a distinct edge during liquidity expansions — especially when central banks and governments are actively injecting capital into the system. Combined with its decentralised structure and fixed supply, Bitcoin also offers a compelling hedge against inflation and currency debasement, making it a powerful tool for maximising returns in a liquid macro environment.
Current Liquidity Dynamics
Last month, we noted our growing concern over the lack of appetite for liquidity injections from central banks globally. In the US, the Federal Reserve’s liquidity provision has notably declined since September. The Fed Liquidity Index dropped sharply from 64.9 to 51.2, primarily due to the rebuilding of the Treasury General Account and sustained political resistance to expanding the Fed’s balance sheet.
While some offset has come via Treasury-led quantitative easing (issuing more short-term debt) and fiscal monetisation, the overall result has been a clear slowdown in domestic liquidity growth.
We believe the global market is now moving into the late stages of the liquidity cycle. Headline liquidity metrics may still appear elevated, but the pace of expansion has slowed materially. Simultaneously, cracks are appearing — evidenced by mounting stress in repo markets and widening SOFR spreads, both early warning signs of systemic strain.
The Fed’s decision to pause its balance sheet runoff and its subtle nods toward renewed expansion suggest an awareness of these pressures. However, the projected injection — around US$250 billion annually — appears inadequate to restore truly “ample” reserves or relieve persistent funding pressure.
With reserve balances still below safe thresholds and a significant wave of Treasury refinancing looming, a decisive reset in the liquidity cycle looks unlikely. For risk assets, this environment is classic late cycle: liquidity is constrained, funding risks are elevated, and tactical portfolio positioning becomes critical as credit conditions continue to tighten.
Short-Term Liquidity Outlook
While we believe the global liquidity cycle is nearing its conclusion, our short-term view remains positive. We anticipate one final acceleration in the rate of change into year-end and early 2026. Our internal indicator has already bottomed at a 5 % rate of change and now looks positioned to exceed the previous local peak set in July.
Beyond this short-term momentum, however, the outlook becomes less certain. It's unclear where the next phase of market strength will emerge from — a key question for asset allocators as liquidity conditions begin to plateau.

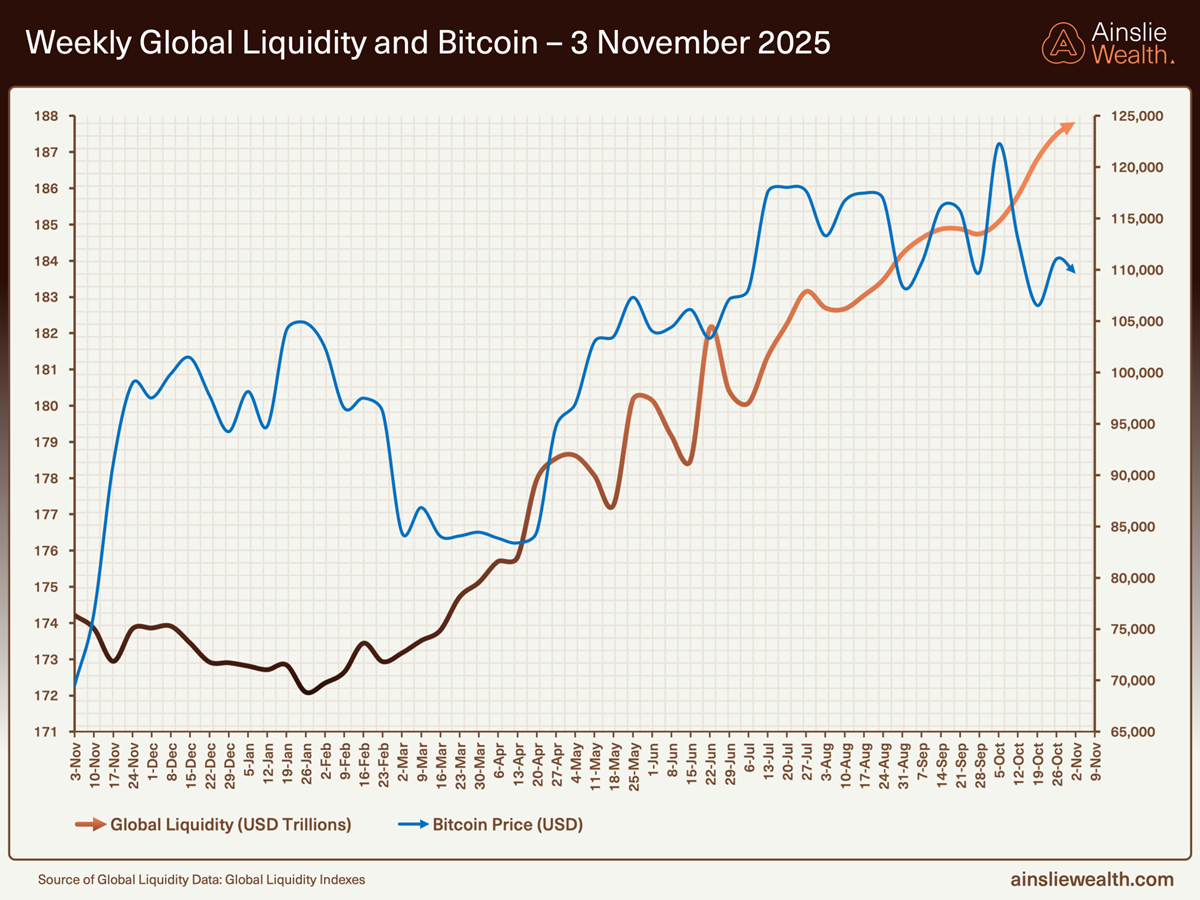
Liquidity Divergence and Bitcoin Price Lag
This month's data reinforces an increasingly visible divergence: global liquidity continues to rise, while Bitcoin’s price has stalled. For many investors, this disconnect is frustrating — particularly as equities like the NASDAQ and S&P 500 notch new all-time highs.
Unless Bitcoin is pre-emptively pricing in a liquidity contraction (which we do not see as our base case), the most likely scenario is a swift catch-up. Bitcoin’s track record suggests delayed but often aggressive re-correlation with liquidity trends — a key dynamic we continue to monitor closely.
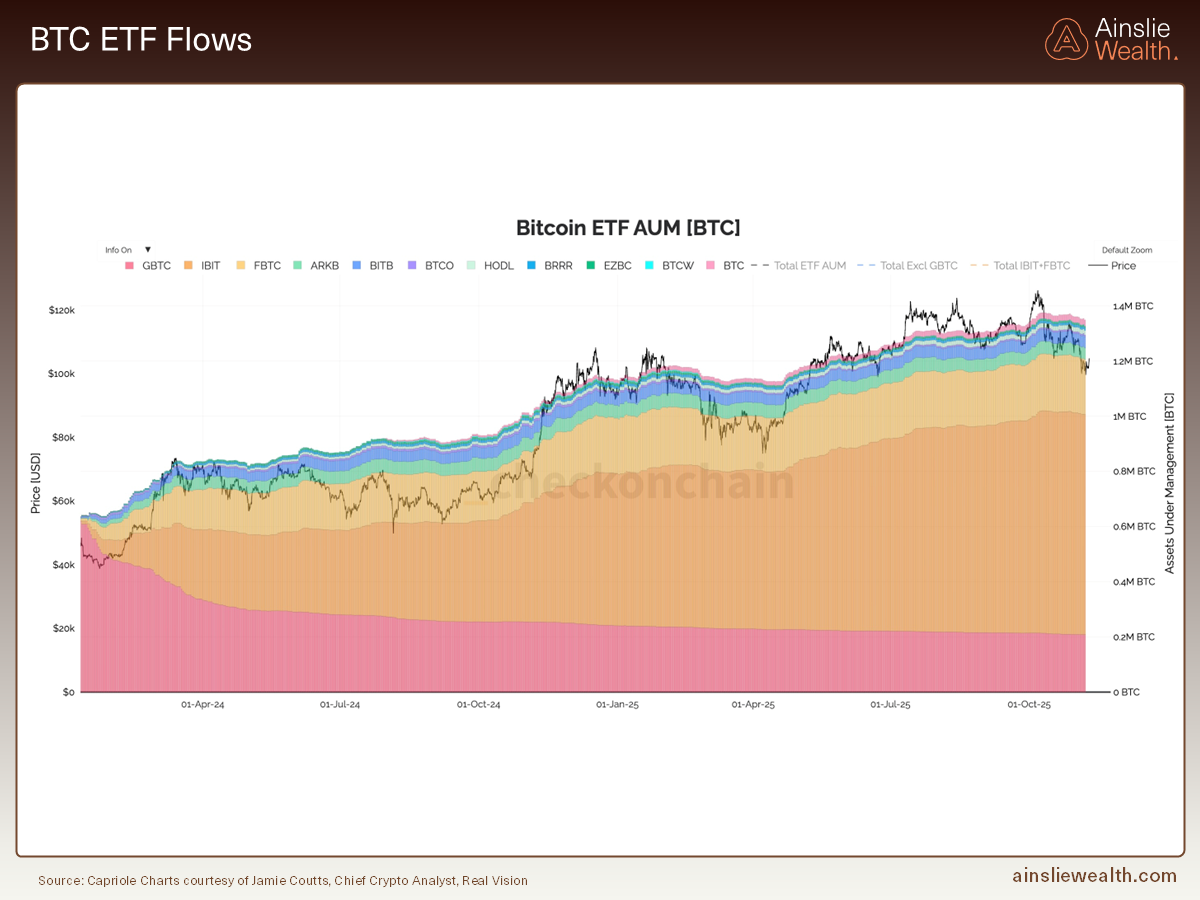
Bitcoin’s “Silent IPO”
US-listed Bitcoin ETFs have experienced consistent but modest outflows over the past month, with holdings down approximately 21,000 BTC — from a peak of ~1.375 million to ~1.354 million. Given soft sentiment and the movement of long-dormant coins, this is a relatively mild reduction and reflects ongoing institutional conviction despite recent volatility.
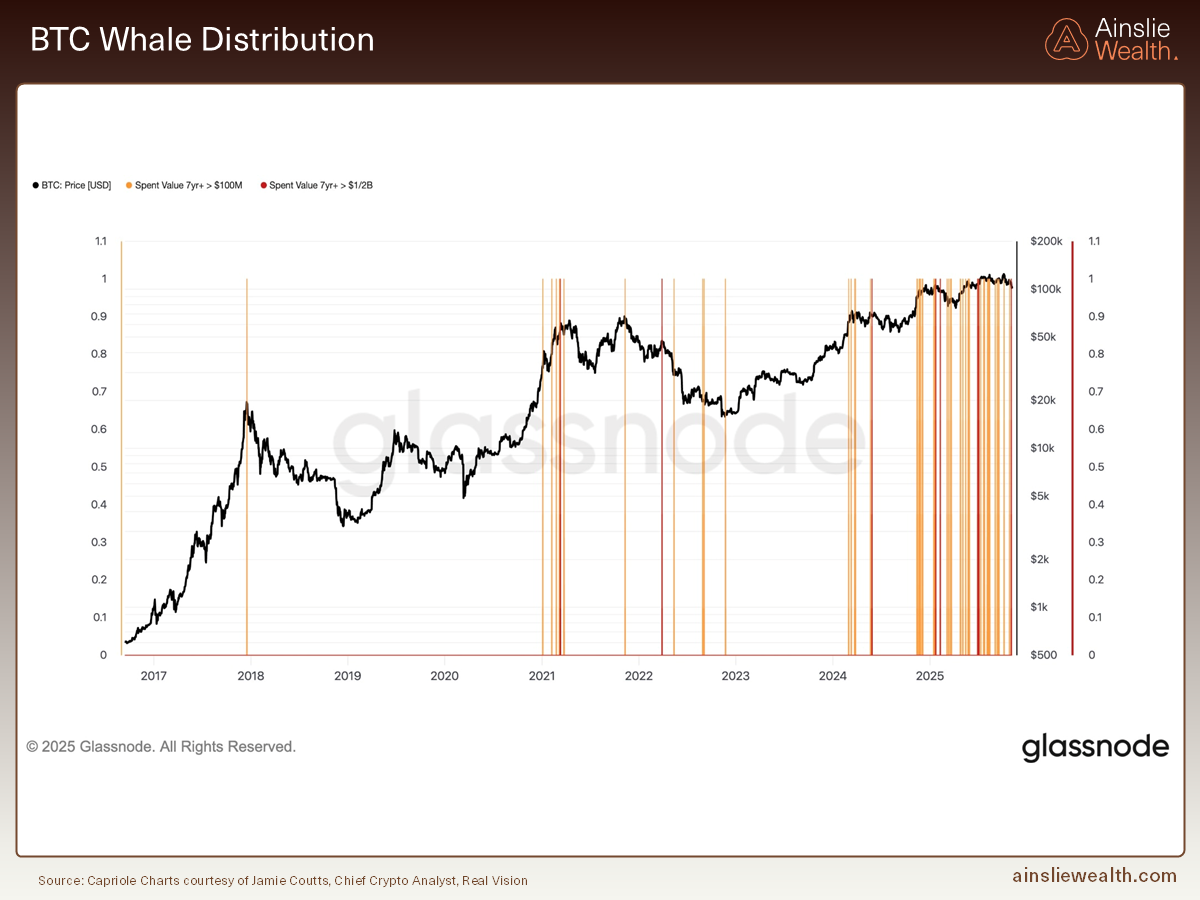
What’s playing out now is a significant distribution event among “OG” whales — long-term holders with coins dormant for over seven years. On-chain data shows multiple days where US$100 million to over US$1 billion worth of these older coins have moved, even as Bitcoin remains near historical highs.
Importantly, on-chain movement does not mean sales. While coin transfers to exchanges may signal future selling, many large transfers are internal, custodial, or security-related, not outright exits. This context is essential — and supports the view that Bitcoin is not undergoing a capitulation event, but rather a structural transition.
A recent Substack piece by Jordi Visser, Bitcoin’s Silent IPO, offers valuable perspective on what’s unfolding on-chain. It ties directly to the wave of long-term holders distributing, while new capital continues to bid consistently — despite recent market stagnation.
In short, Bitcoin appears to be in the midst of a “silent IPO” — a distribution phase where early adopters are methodically selling down positions to both institutional and retail investors. This mirrors traditional IPO lock-up expirations: even amid broader market rallies, early investors gradually take profits, leading to temporary consolidation rather than breakout price action.
While Bitcoin’s recent price action has lagged risk assets like equities, this is not necessarily a sign of weakness — it’s a sign of maturation.
Fundamentals remain robust. ETF inflows are steady, institutional adoption is deepening, network security is stronger than ever, and the regular halving cycle continues to constrain supply. The current sellers are not exiting out of loss or disillusionment — they are exiting because they’ve won. Their accumulated wealth is being redistributed to a broader and more diversified set of holders.
This transition is critical: ownership is shifting from a concentrated base of early “OG whales” to millions of long-term holders, institutions, and passive index vehicles. That dispersion reduces systemic risk and dampens volatility — setting the stage for a more resilient Bitcoin that can handle greater capital inflows with less disruptive price movement.
Drawing on historical tech IPO analogies — such as Amazon, Google, and Facebook — this consolidation period is expected to last 6 to 18 months, with intermittent pauses and sideways movement. Once complete, Bitcoin is likely to re-correlate with broader risk assets and enter a renewed growth phase — one grounded in institutional-grade maturity, not speculative mania.
This evolution marks an important shift in Bitcoin’s role: from high-volatility asset to credible global monetary instrument — a cornerstone in portfolios seeking long-term, inflation-resistant, liquidity-sensitive exposure.

Conclusion
Markets are now firmly navigating the late stages of the global liquidity cycle. While headline liquidity remains elevated, the underlying momentum has decelerated sharply. Signs of strain — such as stress in repo markets and widening SOFR spreads — suggest mounting pressure beneath the surface.
The US Federal Reserve’s abrupt pause in balance sheet runoff, and hints of potential renewed expansion, are clear acknowledgements of these growing structural fragilities. Yet, with only around US$250 billion in projected annual injections, current measures appear insufficient to restore truly “ample” reserves or relieve persistent funding challenges — particularly in the face of a historically large Treasury refinancing burden.
As growth shifts towards targeted fiscal stimulus, and with inflation remaining stubbornly high, central banks appear much closer to the end of their easing cycles than the beginning. A return to the Fed’s 2 % inflation target looks increasingly remote. This backdrop leaves risk assets operating in a classic late-cycle environment: tighter credit, waning liquidity, and heightened sensitivity to shocks.
Amid this complex macro landscape, Bitcoin continues to evolve. What may seem like frustrating price stagnation and whale distribution is, in fact, a defining phase of maturation. The “Silent IPO” marks a pivotal shift — from concentrated, early-stage holders to broad-based institutional and retail ownership. This transition reduces volatility, disperses systemic risk, and lays the groundwork for Bitcoin to emerge as a durable global store of value.
With systemic liquidity, policy direction and market sentiment each in flux, the importance of strategic, long-term positioning has never been more critical.
Watch the full presentation with detailed explanations and discussion on our YouTube Channel here:
Until we return with more analysis next month, keep stacking those sats!
Joseph Brombal
Research and Analysis Manager
The Ainslie Group
x.com/Packin_Sats