
Bitcoin Analysis: Beyond the Block – May 2026
Today the Ainslie Research team (ainslieresearch.com) brings you the latest monthly update on Bitcoin – including the Macro fundamentals, market and on-chain technical metrics and all of the other factors currently driving its adoption and price. This summary highlights some of the key charts that were discussed and analysed by our expert panel. We encourage you to watch the video of the presentation in full https://www.youtube.com/watch?v=diWIuNoCMEw for the detailed explanations.
Bitcoin and Global Liquidity
Bitcoin is the most directly correlated asset to Global Liquidity. Trading Bitcoin can be thought of as trading the Global Liquidity Cycle, but with an adoption curve that leads to significantly higher highs and lows each cycle. As such we look to buy Bitcoin during the 'Bust' phase or liquidity low, then rotate out of it during 'Late Cycle' where liquidity is over extended and downside protection is required (our preference is to rotate into Gold). When correctly timing and structuring the rotation, it is possible to significantly outperform ongoing monetary debasement. The Bitcoin cycle low was in November 2022, and since then the returns have been unmatched by any other major asset.
Where are we currently in the Global Liquidity Cycle?
Welcome to the written report for May Beyond the Block. Those who also view our Beyond the Block podcast on YouTube will be aware of our new product, the Ainslie Bitcoin Bullion Fund. In short, the fund is a wholesale managed fund that actively allocates between Bitcoin, gold, and silver, aiming to deliver strong capital growth while protecting downside risk with precious metals during Bitcoin drawdowns. Our dynamic investment approach is directly guided by the macro and liquidity cycles covered in Beyond the Block analysis, which forms the core foundation of the Fund's investing framework and asset allocation decisions.
If you qualify as a wholesale investor and would like to learn more about the Ainslie Bitcoin & Bullion Fund, visit our official information page at https://www.ainsliewealth.com/ainslie-bb-fund.
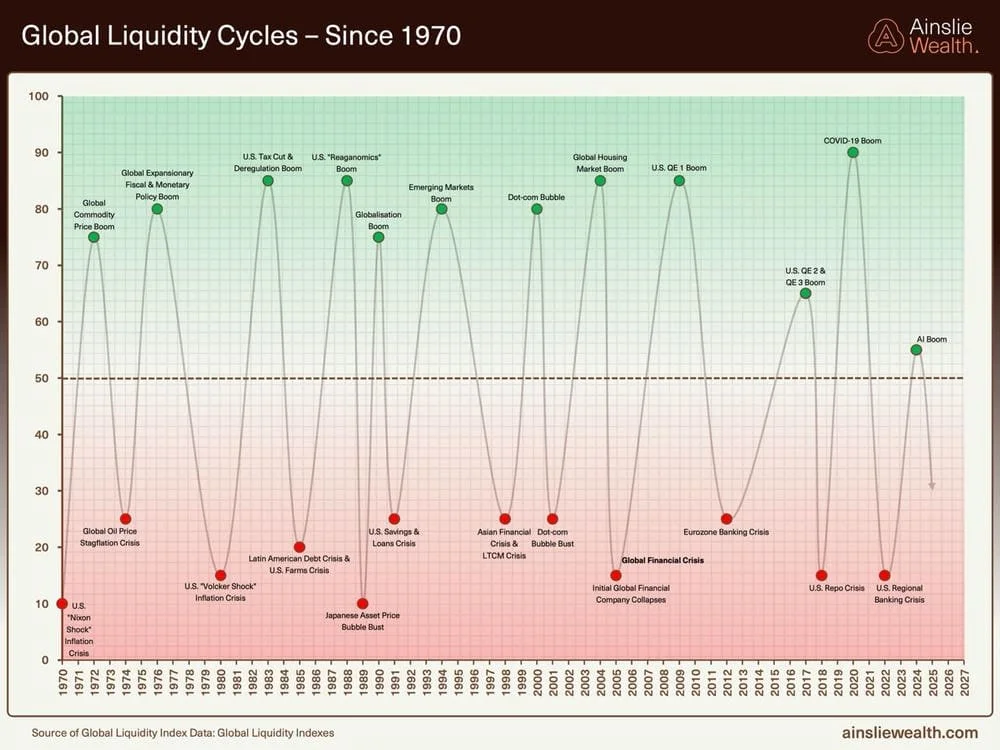
This month we want to put the whole story on one page, this cycle is not different. Going back to 1970 you can see liquidity expanding and contracting around the same 50 line, with each peak carrying its own narrative, the Reaganomics boom, the dot-com bubble, the QE eras, the COVID surge, and now the AI boom. The labels change, the catalysts change, but the rhythm holds. What that long history tells us is that liquidity cycles die of old age, and the current upswing has now run long enough that we should be looking for the rollover, not the next leg up.
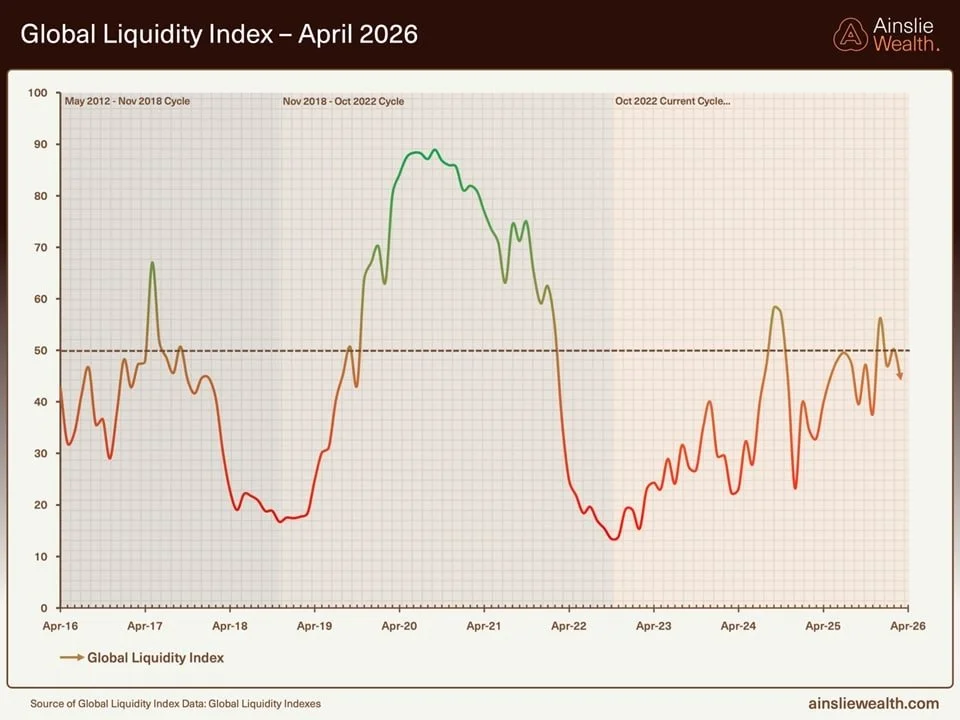
Zooming into the past decade gives us the same message at higher resolution. The monthly Global Liquidity Index peaked around 57 late last year and now sits at roughly 46, working its way lower in a series of sharp rallies that quickly lose momentum, followed by equally sharp drawdowns. That is exactly the kind of choppy, sideways action we expect when a liquidity cycle is rolling over in stages rather than launching into a fresh multi-year expansion.
For context, the previous cycle bottomed near 15 in late 2022, which was the buy signal we acted on at the time. We are not pretending to know the exact level of the next trough, it may be 20 or 25 rather than the deep teens, but the direction of travel is what matters. From here the path of least resistance for the index is lower, and history says these descents tend to take 18 to 24 months from the highs.
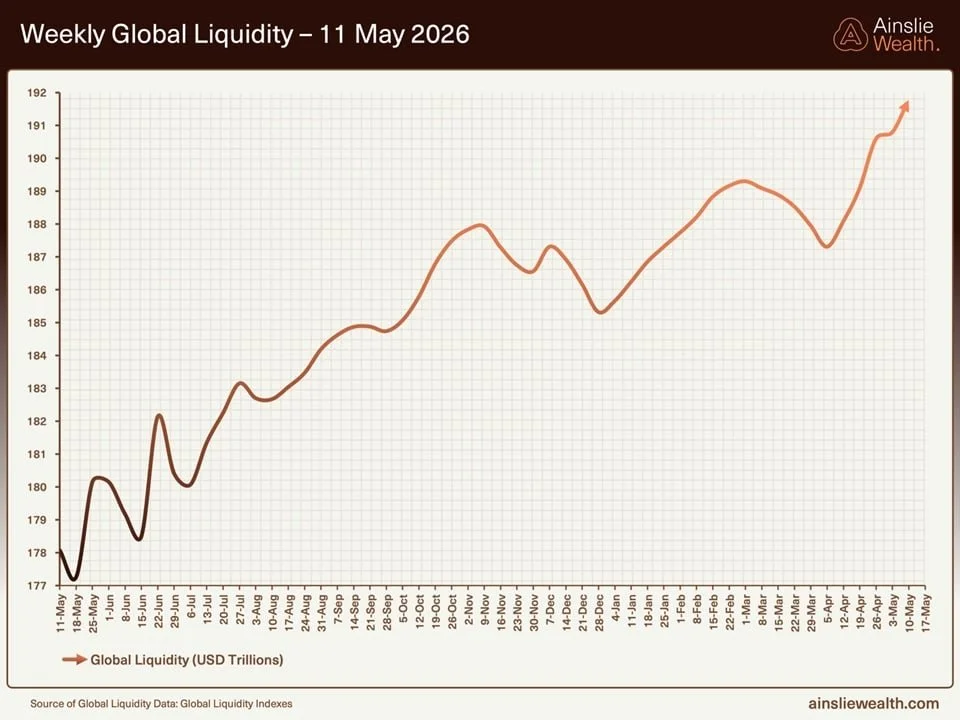
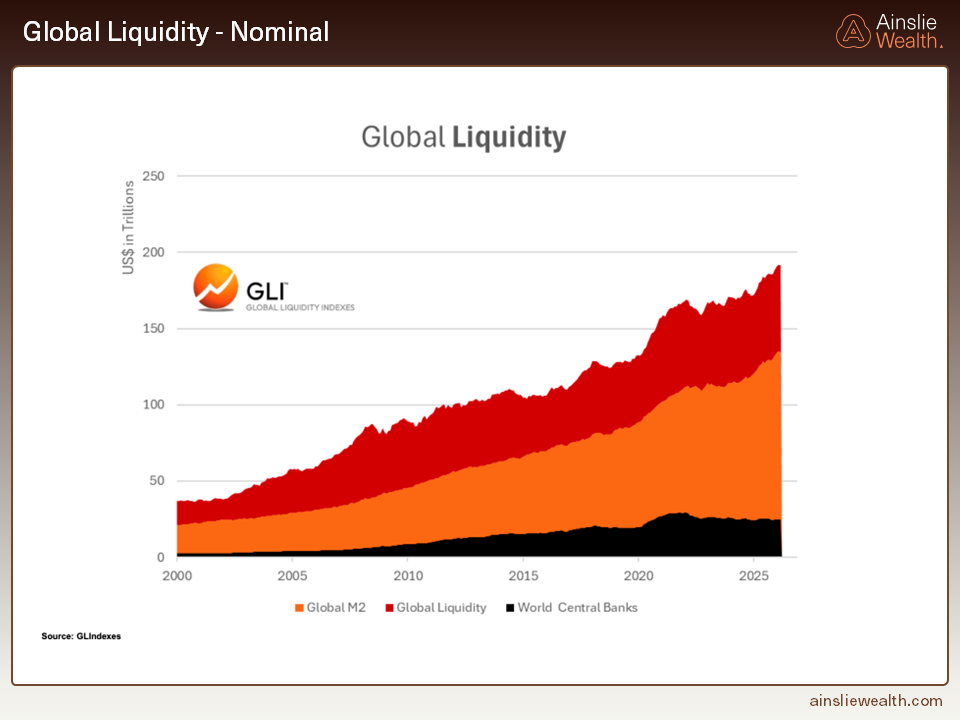
The weekly nominal series is the chart that traps people. Global liquidity just printed a fresh record at around US$191.8 trillion, and on a 3-month annualised basis it is growing at close to 8%. If we just showed you this chart in isolation, the conclusion would be that everything is fine, liquidity is up and to the right, life is good. We have flagged month after month that it is not that simple, and this is exactly where the framework earns its keep.
The thing to focus on is the rate of change at the margin, not the absolute level. The headline number is being flattered by weak base effects from a year ago that will roll off over the next couple of prints, and the engines pulling that line higher, dollar weakness and a suppressed MOVE index, are running out of road. The nominal level can keep grinding up while the underlying cycle is rolling over, and that is the regime we are in right now.
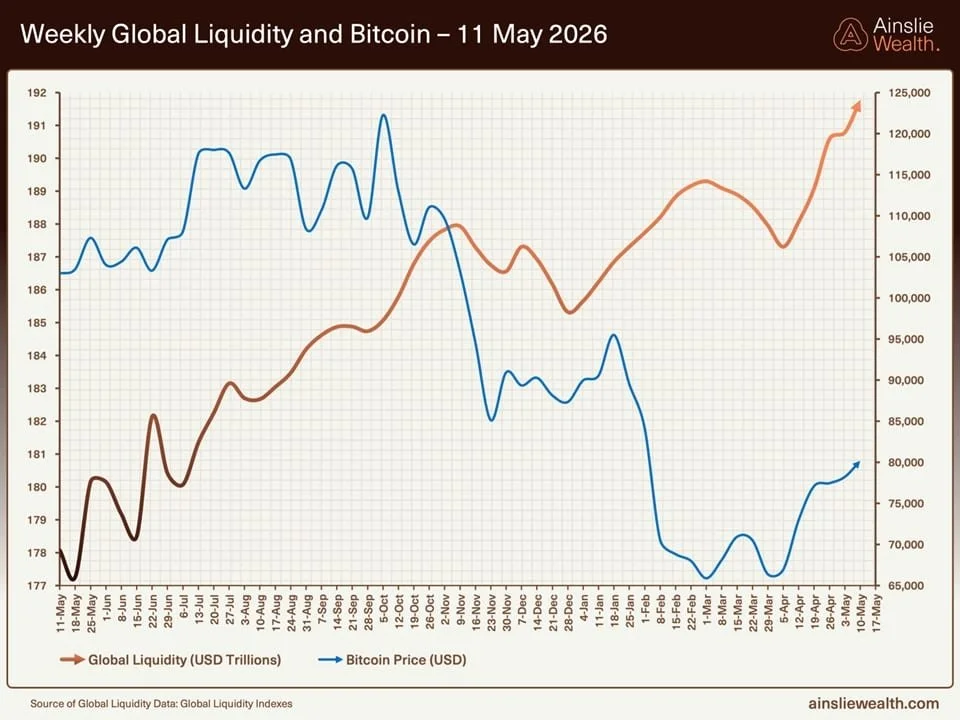
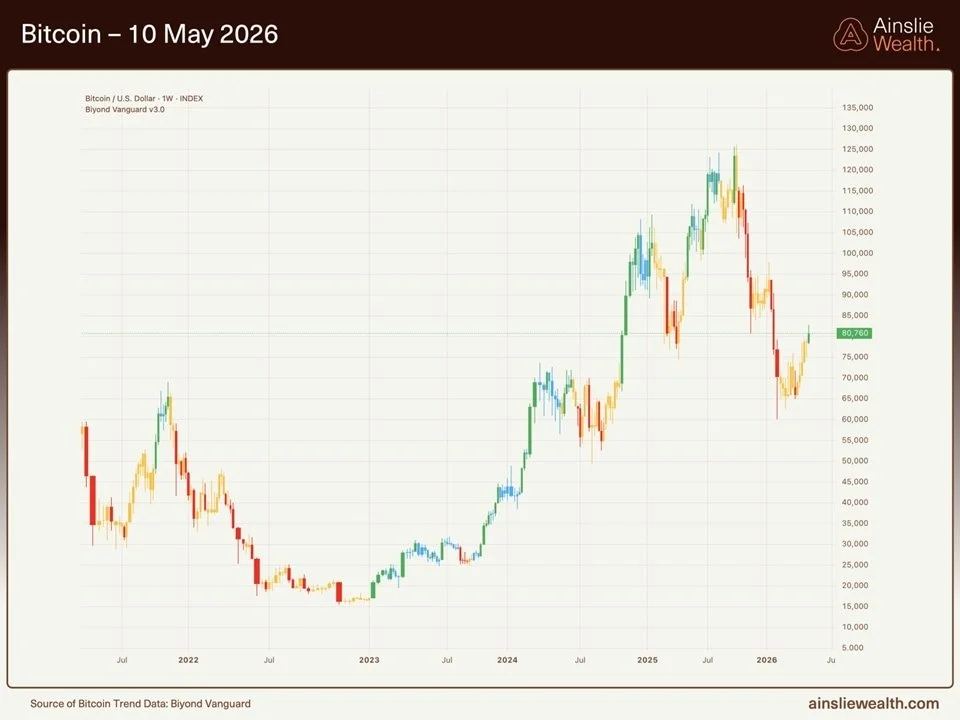
Overlay Bitcoin on top of that weekly liquidity line and you can see the divergence we have been talking about. Liquidity has grinded higher to fresh nominal highs while Bitcoin sold off from the $125,000 peak last year all the way down to the $67,000 low in March, recovering to $80,760 as we write. That is unusual, Bitcoin is normally a forward-looking expression of liquidity, and when the two pull apart this much it is telling us something.
Our read is that Bitcoin has already done the heavy lifting on pricing in the late-cycle headwinds we keep flagging, while the nominal liquidity line is yet to fully reflect them. That creates a setup we find quite attractive, plenty of macro headwinds for liquidity from here, but a Bitcoin price that has moved well ahead of the deterioration we actually see in the underlying drivers. Even a modest positive surprise, a softer dollar, a Fed signal, a funding wobble, could see Bitcoin mean-revert back towards the liquidity trajectory, offering significantly more upside than downside over a multi-year horizon.
On the Bitcoin chart itself, price has recovered from the $67,000 March low to $80,760, a roughly 20% bounce off the lows. That has cleared a few near-term levels and has shorts getting squeezed in the process, the kind of staircase price action that fools a lot of people into calling the bottom. We are not in that camp. The rally so far looks transitional rather than confirmed bullish, and the historical bear-market lows have almost always involved one final flush after a recovery of this size, not a V-shaped recovery straight to new highs.
The point is not to predict the exact path, it is to be honest about the fuel. The macro is not supplying the kind of liquidity impulse that drives a sustained breakout from here, so even if we grind a little higher, we struggle to see what funds the next leg toward six figures and beyond before liquidity bottoms. Bitcoin spends the bulk of its time in chop rather than trending, and with the liquidity backdrop rolling over, our base case is sideways and lower before the next real cycle low.
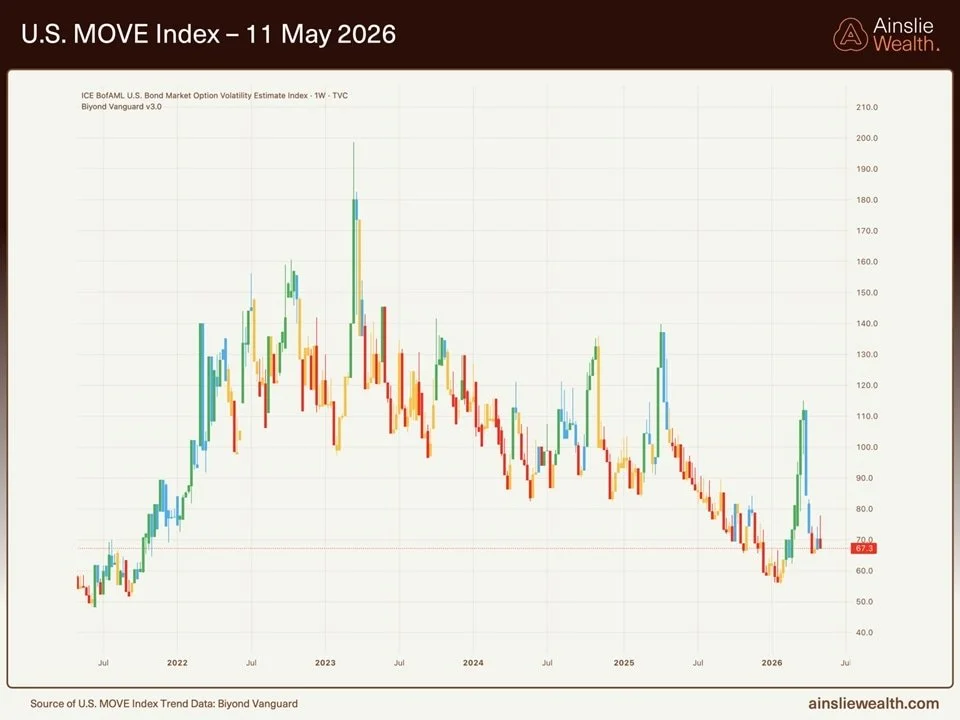
The MOVE index is the chart we want everyone to pay attention to this month. It sits at 67.3, near the bottom of its long-term range, and has been suppressed there pretty much all year. That is not happening by accident. The US Treasury is actively engineering it through buybacks, roughly US$28 billion of long-end buybacks for every 10-point rise in the MOVE, funded by issuing more short-term debt. The whole point of that operation is to keep bond volatility low so collateral haircuts compress, and the multiplier on the rest of the liquidity stack can stay high.
The problem is that this kind of suppression cannot run forever. You can only squash a beach ball under water for so long. The MOVE is now sitting near the complacency floor around 60, which historically is where volatility shocks come from, not where they get absorbed. The benign backdrop we have enjoyed for the past few months is not the new normal, it is a fragile equilibrium, and the moment bond volatility starts to re-price higher, the same mechanism that has been supporting risk assets flips and becomes a headwind.
Macro Indicators
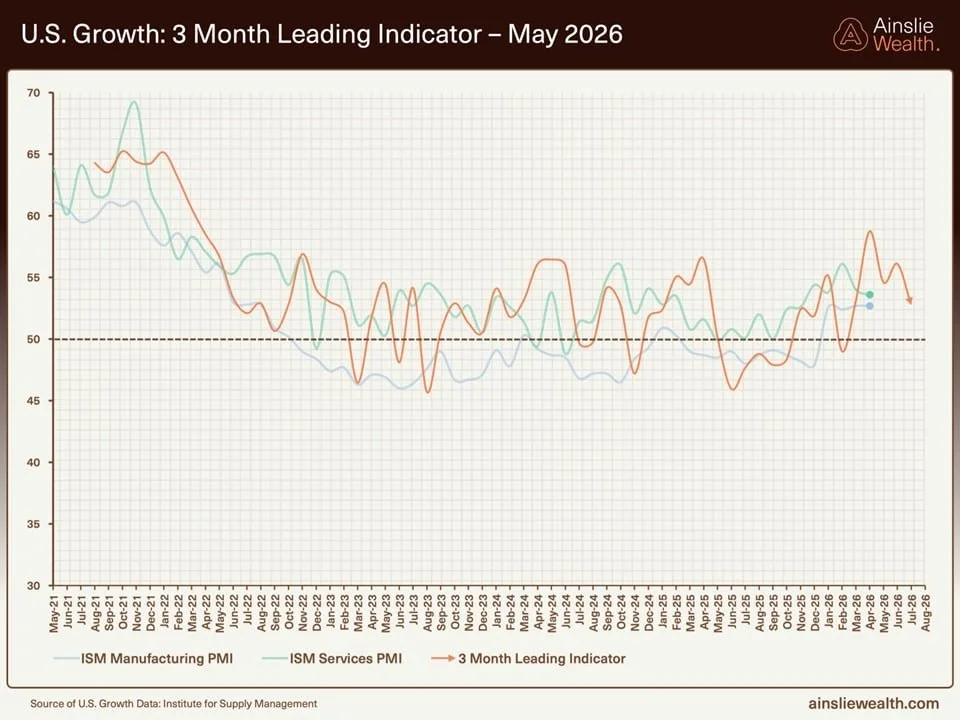
Our 3-month leading indicator on US growth still sits above the 50 expansion threshold at around 53, with ISM Manufacturing at 52 and ISM Services at 53. The economy is clearly still in expansion territory, but the leading indicator has rolled over from its 58 peak earlier in the year and is now grinding lower at the margin. Main Street activity is holding up, particularly off the back of the AI capex boom and ongoing fiscal support, but the rate of change is no longer working in its favour.
This is exactly what we expect to see late in a liquidity cycle. The US economy is being propped up by deficit spending and the AI build-out, both of which need ever-larger doses of stimulus to keep the party going. The forward indicator is starting to call time on that, and when you line it up against a 60 to 65 month liquidity cycle that should be rolling over right about now, the picture is consistent. None of this means recession tomorrow, it just means the strongest months of this expansion are behind us.
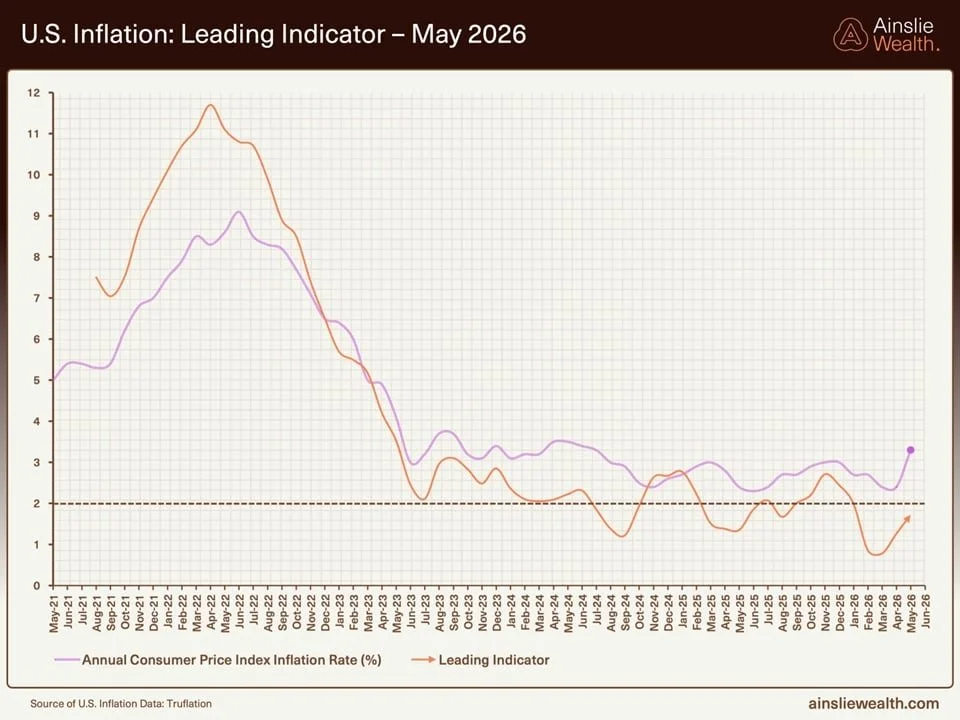
The inflation lead indicator continues to point lower over the next few quarters, even with the headline noise from the Iran conflict pushing oil and gasoline higher at the margin. Headline CPI ticked up to 3.8% in April, the highest print since May 2023, but the Truflation leading indicator has fallen to 1.72%, well below the Fed's 2% target, and it typically anticipates CPI by three to four months. Core CPI at 2.8% tells a more honest story than the headline, the energy-driven bump in top-line prints reads more like a tax on the consumer than the start of a new inflation cycle.
Underneath all of this, the deflationary forces are still doing their work. AI-driven productivity gains, white-collar repricing, and ongoing cost-cutting are quietly stripping cost out of the system. The labour market is softening at the edges, with unemployment drifting higher and participation slipping. In that world, the bigger medium-term risk is growth rolling over into a disinflation problem that eventually drags the Fed into deeper cuts and, if needed, full QE, a backdrop that historically has been far more supportive for Bitcoin and global liquidity than for the real economy in the short term.
The debt and yields chart tells the late-cycle story in one frame. US government debt has pushed through US$39 trillion and continues to climb on its parabolic path, with no political appetite to slow it down. The Fed funds effective rate has been cut to 3.63%, down materially from the peak, and the curve is bear-flattening, with the 30-year at 4.94%, the 10-year at 4.36%, the 2-year at 3.89%, and the 3-month at 3.69%.
In plain English, the front end has been guided lower by Fed cuts while the long end refuses to come down with it. That bear-flattening shape is the regime signature of late-cycle liquidity, the bond market is telling us policy is loosening at the front but discipline remains at the long end. The next round of Fed support, when it comes, is unlikely to be much further on rates, it will come through balance-sheet plumbing and bank deregulation, both of which are already quietly running in the background. None of that gives us a fresh liquidity impulse big enough to turn the cycle, it just keeps the existing structure upright a bit longer.

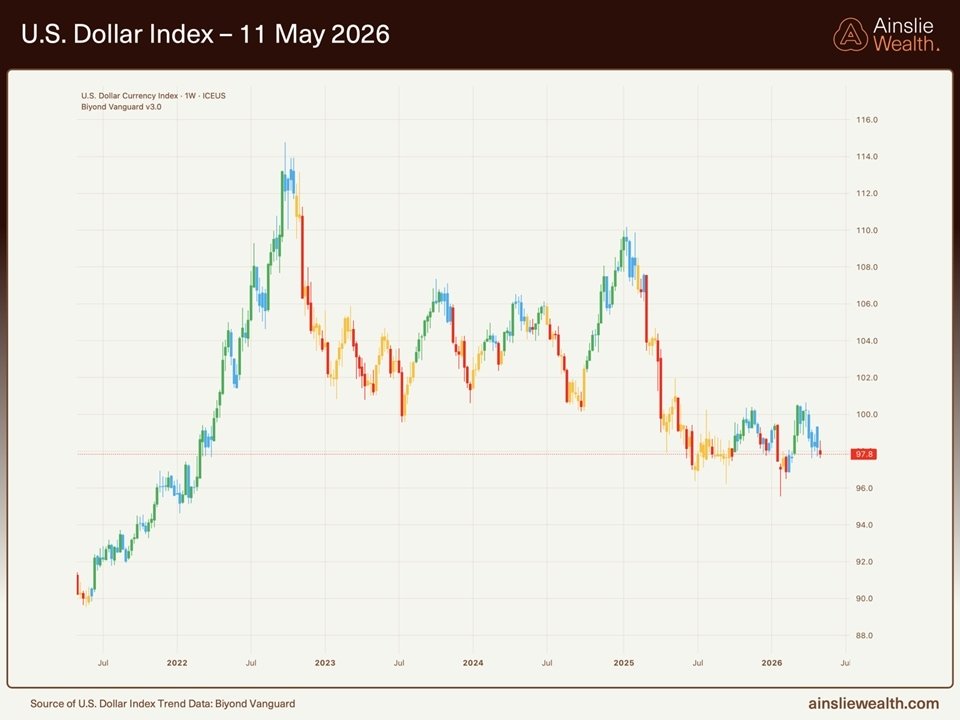
The US dollar is the swing factor for global liquidity, and it is doing the heavy lifting on the nominal numbers right now. The DXY sits at 97.8, having weakened from near 100 through April, which lifts the dollar value of non-US central bank liquidity and improves financial conditions for offshore borrowers. That is supportive at the margin, but the more interesting point is what has not happened. Even with the Iran conflict in the background, the kind of geopolitical backdrop that would historically drive a sharp risk-off dollar rally, the DXY has refused to spike.
That is either the calm before something nasty, or a sign that the dollar has quietly peaked in cyclical terms. Either way, the room for further dollar weakness from here is limited, you can only fall so far before the move loses its juice as a liquidity input. A sustained dollar squeeze would tighten conditions fast, which is the tail risk we keep one eye on, but the base case is more range-bound action and a slow drag on the headline liquidity tailwind.
Liquidity Cycle Still Rolling Over
This is the chart that ties our whole framework together. The orange band is Global M2, which is just bank deposits and government-driven money supply, and it keeps growing regardless of where we are in the cycle. That is what most commentators point at when they say liquidity is fine. The red band on top is the broader Global Liquidity number that takes us to around US$190 trillion, and that is what we mean when we talk about liquidity at the headline level.
The piece that matters, though, is the black wedge at the bottom, the central bank liquidity, the shadow monetary base that everything else is built on top of. If you look closely you can see that black layer has actually been collapsing in recent years, even as M2 keeps grinding higher. That is the fragility we keep coming back to. The whole debt-based system is leveraging up on a shrinking foundation, and the longer that divergence runs, the more sensitive the system becomes to any disruption in the multipliers above it, the dollar, the MOVE index, the collateral pool. The headline number looks fine, the base it sits on does not.
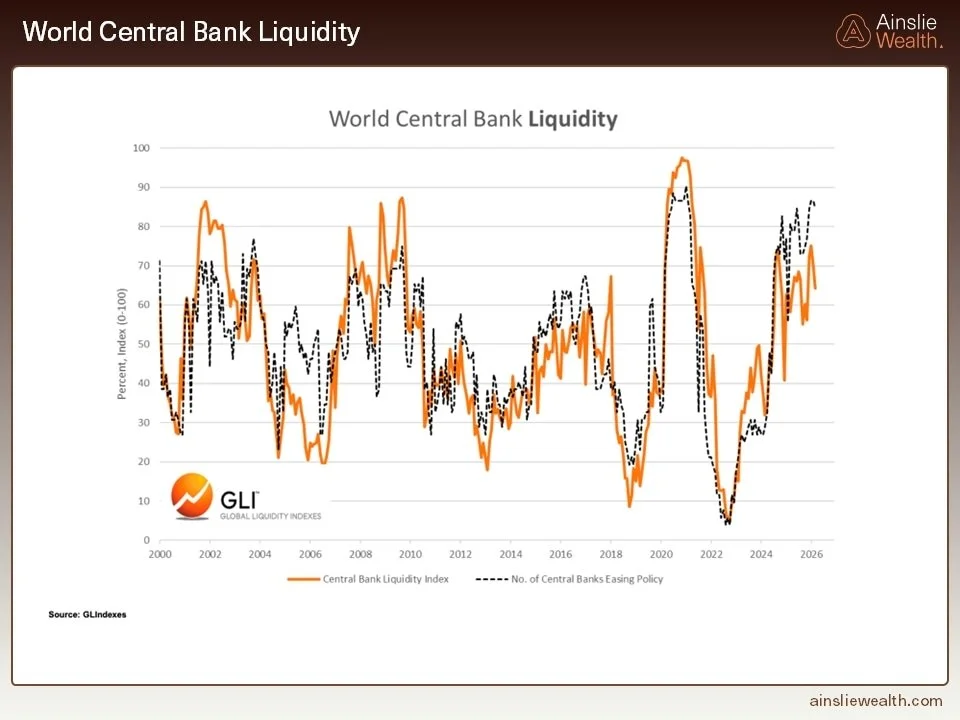
The World Central Bank Liquidity chart confirms that the easing engine is already at full throttle. The orange line is the central bank liquidity index, weighted towards the largest banks, the Fed and the ECB, and the dotted black line is the percentage of central banks in easing mode. Both are sitting near the top of their historical ranges, with somewhere around 85% of global central banks currently cutting rates or adding liquidity.
That is a setup that is priced for perfection rather than a fresh source of upside. If you have been waiting for the next "Fed pivot" to save markets, it has already happened, and most of the rest of the world is already there with them. There is no second gear here without a genuine crisis to force a more aggressive policy response. Locally we are the exception, the RBA is now three rate hikes into a new tightening cycle with the cash rate back at 4.35%, but in aggregate the global central bank impulse has done what it is going to do without something breaking first.
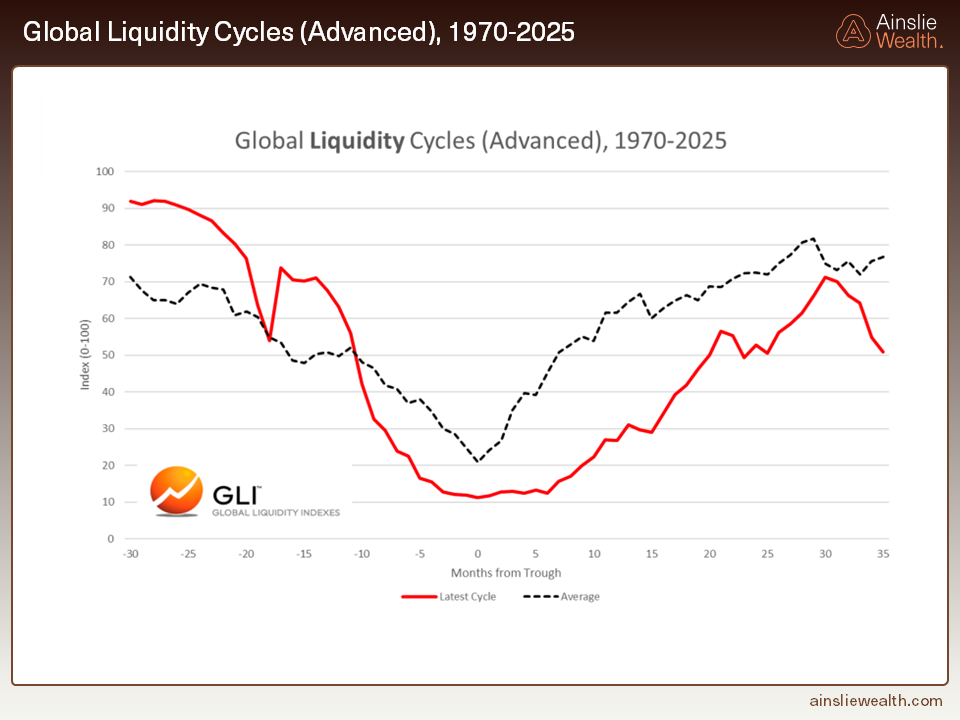
Lining the current cycle up against the average since 1970 makes the time argument hard to argue with. The red line is the current cycle, the dotted black line is the average. We are about 30 months into this expansion from the late-2022 trough, which is essentially bang on the historical average length of a liquidity upswing. Liquidity cycles run roughly 60 to 65 months bottom-to-bottom, so on time alone, we should be at or just past the peak.
The level is less important than the timing here. This cycle has run hotter than average in amplitude, which makes sense given the COVID surge that preceded it and the scale of fiscal support since, but the clock has not changed. If the historical timings hold, the next true liquidity low is somewhere around late 2027, and the risk/reward on the index from here is firmly skewed to the downside.
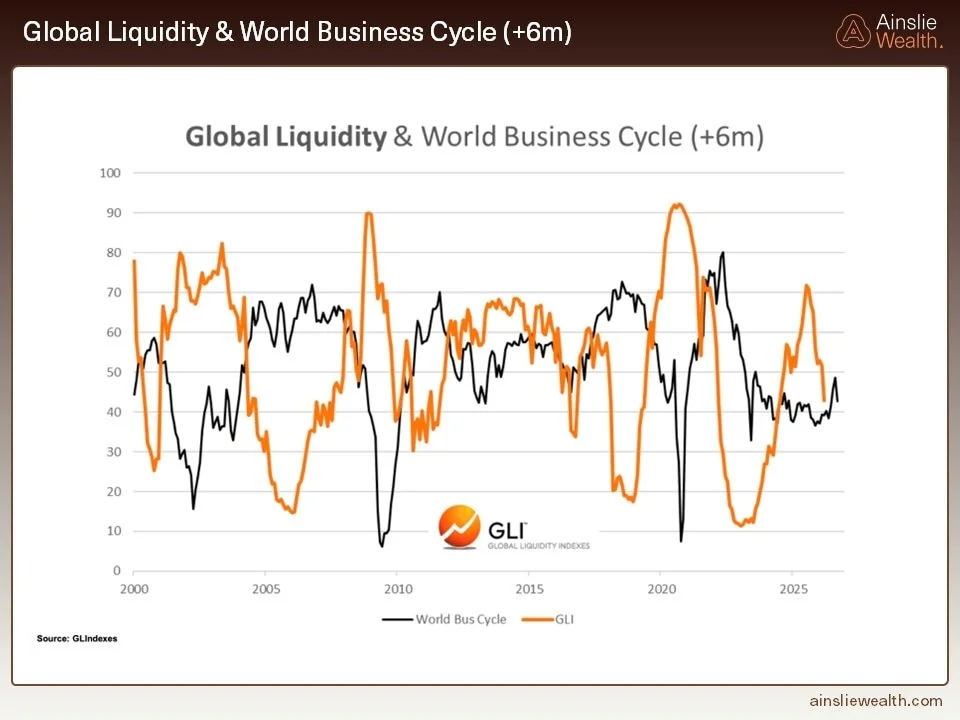
One of the questions we get most often is why a strong economy and easing central banks can coexist with weak financial market liquidity, and this chart is the answer. The orange line is global liquidity, the black line is the world business cycle, and they move countercyclically with about a six-month lag. When the business cycle is weak, policymakers reach for the toolkit, rate cuts, deficits, QE, and pump liquidity into the financial system. That liquidity then flows into the real economy roughly six months later as firmer PMIs, stronger employment, and rising commodity demand.
Once the real economy is clearly booming, like it is now in the US, the political pressure to ease fades, central banks step back, and liquidity rolls over even while growth still looks fine. On top of that, the real economy is now actively absorbing balance sheet capacity that used to amplify financial-asset moves, principally hyperscaler capex and AI infrastructure. The squeeze on financial-market liquidity right now is not coming from a recession, it is coming from the real economy succeeding. A stronger economy does not always mean stronger financial markets.
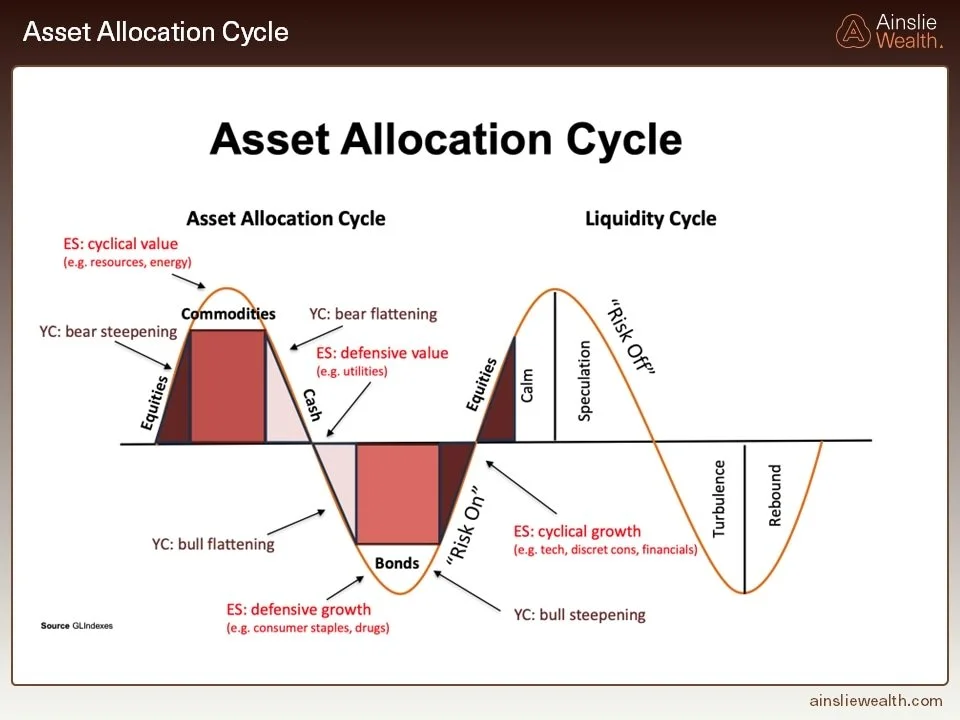
Pulling it all together with the asset allocation framework, the picture is remarkably tidy. The diagram lines up the asset allocation cycle on the left with the liquidity cycle on the right. Early in the upswing, when liquidity is cheap and expanding, the market piles into risk-on, growth stocks, speculative tech, smaller caps and, in our world, Bitcoin. As the wave turns over, leadership rotates into commodities and cyclical value, resources, energy, miners, before eventually moving into defensives like utilities and staples on the way down.
What we are seeing today fits that script almost perfectly. We are sitting at the top of the wave in the Speculation zone, with the commodity complex doing the heavy lifting, gold near US$4,700, silver clearing US$80, copper and uranium bid, and energy outperforming. That is textbook end-of-cycle rotation, right on schedule. The next phases on this map are Turbulence and then Rebound, and that is where the real Bitcoin accumulation window opens, around a trough somewhere in 2027 that we have been pointing to all year. None of this is a reason to panic, it is a reason to stay disciplined.
Conclusion
This is exactly the kind of month where the framework matters more than the headlines. Nominal liquidity is at fresh highs, the US economy is still expanding, the dollar is well-behaved, and Bitcoin has bounced 20% off the March low. On the surface, life is good. Underneath, the monthly liquidity index has rolled from 57 to 46, the shadow monetary base is hollowed out, the MOVE is being held down by treasury buybacks, the growth leading indicator has peaked, and the asset allocation cycle has rotated into commodities. The cycle is doing exactly what cycles do, and we are exactly where we should be.
For Bitcoin specifically, we remain long-term bulls, that has not changed, and it will not change. What we are flagging is that the next six to twelve months are most likely going to be a grind. Sideways and lower is our base case, with the real opportunity setting up into a liquidity trough somewhere in 2027. At $80,760, Bitcoin is not expensive, and on a four-year-plus horizon, almost any entry around here works out fine. The point is that you very likely will get a better one, so dollar-cost averaging and patience are the strategies that pay this year. If you have not got enough, you should be waking up every day praying it goes lower, because that is exactly the environment where disciplined accumulation does the heavy lifting for the next cycle.
We can see plenty of scenarios that would force the Fed to step up support before that 2027 trough arrives, a funding squeeze, a disorderly move in bonds, a deeper rollover in growth and employment, or something we have not thought of yet. We are watching for any of those, but the charts do not justify trading as if the cavalry has already arrived. For now, we are in a late-cycle environment with clear liquidity headwinds, a still-growing real economy, and a Bitcoin price that has moved well ahead of the deterioration we actually see in the data. In our view, that combination offers attractive asymmetrical risk/reward for patient capital willing to accumulate into weakness and let the next liquidity cycle do the heavy lifting.
Watch the full presentation with detailed explanations and discussion on our YouTube Channel here: https://www.youtube.com/watch?v=diWIuNoCMEw
Until we return with more analysis next month, keep stacking those sats!
Joseph Brombal
Research and Analysis Manager
The Ainslie Group